Applying Just Culture to improve investment decisions

Sunday 9 June 2019

Paragon Care looks cheap, but is it cheap enough? (ASX:PGC)


09/06/2019

Trav Mays


Paragon Care (ASX:PGC) was established after some questionable behaviour by its previous company directors. On the 27th of September 2005, Citrofresh (Paragon Care’s previous name) stated that “the use of Citrofresh as a post-coital application will act as an “invisible condom” for the prevention of STD’s including HIV”. As the share price skyrocketed to a peak of 70c (opened at 22c) the next day, a former independent director, Mathew Walker and a former chairman, Ron Gajewski, opportunistically sold chunks of their shares for ~57c, highs not seen for roughly 4 years. This trade netted them $577,000 and $281,000 respectively; within 4 months, both had resigned without disclosing cause. After a couple of director changes and some other upper level management shenanigans, Mark Simari, the man who would transform Paragon Care from a sanitary solution company to a Health and aged care conglomerate was hired (April 2008).

Drawing on his many years of experience as a Director of a number of investment firms, Mr Simari’s first steps were to change the name of Citrofresh to Paragon Care and to initiate a 6 point growth strategy, essentially a roll-up strategy. A fairly predictable move, given Mr Simari’s Linkedin page states that “my first love has always been, and continues to be, M&A”.The years he spent at the investment firms gave him all the necessary tools to execute a roll up strategy, he was very experienced in raising funds, selecting investment candidates and expanding businesses.

The Corporate Finance Institute describes a Roll Up strategy as “the process of acquiring and merging multiple smaller companies in the same industry and consolidating them into a large company”. A strategy that is effective in markets where there are a number of small players and no large player. Whilst implementing the roll-up strategy, Paragon Care has emerged predominantly as a medical and surgical supplier, selling all things medical, from stainless steel equipment to consumables. An excellent choice of market to execute this strategy in, as a quick Google search of “medical and surgical suppliers Australia” shows, 5 of the first 7 results are small family run companies.


Paragon care acquisitions companies


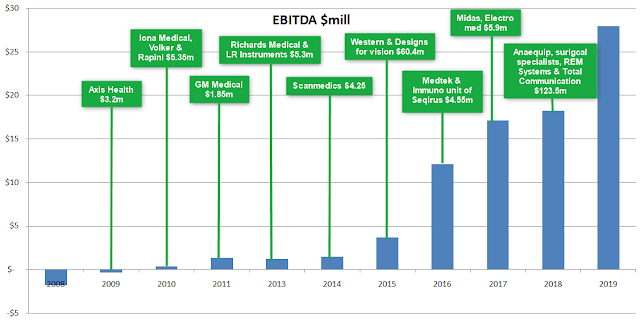
The rollup strategy essentially works, by the acquiring company purchasing other companies that are trading on a lower multiple than itself, once assimilated, the market then assigns the higher multiple to the earnings of the acquired company, pushing the stock price up, allowing the acquirer to raise more funds/debt, purchase another company and on and on it goes. Below I have tabulated the acquisitions Paragon Care have made since 2011, as you can see, all were trading on a lower Price/EBITDA multiple than Paragon Care was at the time (Please note that the price paid in the table is cash only, it doesn’t include any of the earn out costs).

Paragon care acquisitions margins

The speed with which Paragon Care acquired companies would have resulted in a number of redundant, out dated and overlapping processes all of which have the opportunity for streamlining, eliminating nonsensical friction, such as useless paperwork and/or the doubling of forms and data between separate systems. The elimination of friction within an organisation is an easy and at least at the beginning, easily identified form of organic growth. To oversee this form of growth requires a different type of manager to Mr Simari and in January 2018, he handed the reigns over to Mr Andrew Just. Mr Just brings with him over 25 years of global healthcare industry experience, having worked in high managerial roles at companies such as GE Healthcare, Cochlear and Radiometer. Paragon Care subsequently announced that the “major acquisition program is largely complete” and that they would now be focusing on a 9% organic growth target.

Mr Just earned a black belt in Six Sigma whilst working at GE Healthcare, which would have equipped him with the necessary tools to eliminate the nonsensical friction. Six Sigma fundamentally, is a set of techniques and tools that allow the practitioner to eliminate or reduce defects and waste, thereby continuously improving any process. But in practice it is more than that, it retrains the brain, giving the practitioner a new viewpoint with which to see problems and formulate solutions. Typically to obtain the Six Sigma accreditation, a person needs to have a mentor, sit an exam, have worked in a process role for 3 years and to have done 2 Six Sigma based projects, not an easy task. Along with this training, Mr Just spent 2 of the 6 years working at GE Healthcare, a company that Jack Welch infused the Six Sigma dogma within its culture, as an internal business consultant, where he taught and lead six sigma projects, specialising in change management.

Drawing on his many years of experience generating organic growth, one of Mr Just’s first inward focused initiatives was the elimination of 14 different financial, operational, HR, payroll and reporting systems and instead incorporating them all into the one system, Microsoft Dynamics 365. Dynamics 365 is an Enterprise Resource Planning (ERP) and Customer Relationship Management (CRM) software package, that is predicted to save Paragon Care ~3m in FY20. Having worked at a company similar to Paragon Care and seen the impact that Dynamics 365 can have on reducing friction for both employees and for the customers experience, I believe it will have a big impact on Paragon Care, helping to unlock pent-up organic growth.

By implementing the roll up strategy, Paragon Care has taken advantage of all the typical M&A advantages, such as, larger product offerings, the possibility of cross selling, increased geographical foot print, quicker access to whole new markets etc. These advantages are than multiplied during a roll up strategy, it’s like M&A on steroids, it does however work both ways, multiplying the potential pitfalls by just as much. A quick summary of the excellent article on Investment Masters Class titled “Roll up Roll up –Circus Tricks”, which states that whilst some of the investing grates such as George Soros have made considerable amounts of money by identifying roll ups at their early stages; investors need to be wary of roll ups at the end of the acquisition phase.This is because as growth comes from acquisitions, as soon as the acquiring company begins to struggle to generate more funds or find suitable companies, the business falls over.

So what causes a roll up to stop? Any number of things, a slowing economy, risk adverse investors, marco instability, the credit cycle or something as simple as a questionable acquisition, anything that lowers the acquires margin and/or cuts off their supply of capital. In Paragon Care’s case, it was self inflicted, they changed the company strategy to inward growth and subjected themselves to stricter acquisition requirements. This change in strategy can explain some of the recent reduction in share price; another possible cause for some of the price reduction is their inability to divest the loss making legacy capital equipment business. This legacy business is having a material impact on Paragon Care, losing $9.28m after tax in the first half of FY2019. Initially stating that they would sell the capital equipment business as a whole, after being unsuccessful, on the 30th April Paragon Care conceded and announced that they would sell it off as parts, aiming to have the sales finalised by 30th June 2019.

Another cause of the down beaten share price could be due to questionable acquisitions. One potential hazard that Jack Welch describes in his book “Winning” is the need for cultural fit. Mr Welch states that cultural fit is as, if not more important than strategic fit (emphasis mine). Having worked at a company that had been acquired a couple of years prior to my arrival by a company very similar to the makeup of Paragon Care, albeit within a different industry, I have seen the ramifications of a cultural misfit, as Mr Welch says “The fact is some cultures don’t combine, they combust”.

Since its implementation of the roll-up strategy, Paragon Care has acquired a number of companies, the majority of which were similar to the core theme, the standout exception is Midas Software Solutions. As you can probably guess from their name, Midas is a software company. They help to streamline the reporting process of certain heath care faculties by as much as 10mins per report, helping to save (according to the Midas website) between 1 – 2 hours per doctor per day. Having neither worked at Paragon Care nor Midas, this is pure speculation, but the culture at a software company would surely be far different to that of an equipment wholesaler. They do work within the same industry, but the cultural misfit that I worked for was not only within the same industry, but was doing a very similar thing, both selling capital equipment to many of the same customers. This could be one of the components causing the delays in the development of the MIDAS business, which to date has not lived up to expectations. That being said, a good strategy is 10% planning and 90% implementation, so that whilst it may be more difficult, an excellent management team could easily pull it off.

To evaluate a culture at an organisation, I typically check Glassdoor. Unfortunately, neither Paragon Care nor Midas have any entries on Glassdoor, so an investigation into my speculation above has come up fruitless. Paragon Care does however have Google reviews, so we can at least get a slight feel of whether or not they are a customer focused organisation. With an average score of 3.1 from 13 reviews, I’d say that’s pretty good. Clearly not the best sample size, but I believe big enough to get a somewhat realistic view. Google doesn’t give exact dates of reviews, but it’s possible to arrange by review date. Review 1 was made over 2 years ago, reviews 2 – 9 were done over 1 year ago, with the final three being sporadically entered over the past year. As you can see below, after a initial score of 5, their average was brought down quite quickly by two 1’s (1 is the lowest score you can give), but has since trended upwards, quite encouraging, as people are less likely to give good reviews than bad (check out The New York Time’s article titled Why you can’t really trust negative online reviews for some good info and some handy hints to combat this).


Paragon care google reviews

Market

Paragon Care currently has ~3% share of a~$9bn addressable market opportunity (Paragon Care’s target market is roughly 70% of the medical and surgical supplies segment of the health and aged care industry), a small fraction of the $190b spent on healthcare in Aus and NZ annually. A yearly spend that is only going to increase with time. The Australian Bureau of Statistics (ABS) states that ~15% of the 24.6m people living in Australia today are 65 or over, ~3.7m people. Australian is an aging population, with the 65 and over demographic growing at a disproportionate rate to the rest of the population. The ABS predicts that the percentage of people 65 and over will increase to ~17% by 2027. Along with the increase in the percentage of Australians over 65, the general Australian population is also increasing. Over the past 10 years, this growth rate has been roughly 1.6% year on year (YoY). To give us a rough guide on how many people there will be in 2027, using the more conservative and longer YoY growth rate of 1.4%, seen between 1975 and 2006, the Australian population will have increased to ~28m with the 65 and over population reaching ~4.7m people.


sAustralia's aging population Paragon care

Discussion

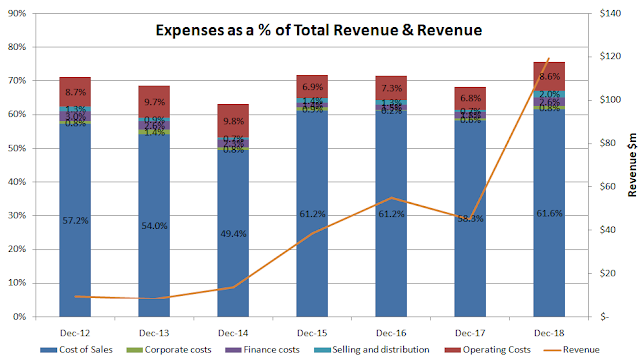
During a roll-up strategy, as so much focus in pointed outwards on inorganic growth, it is easy to allow companies to run rampant on expenses. As you can see below, up until HY2019, Paragon Care has done an excellent job of keeping costs at roughly the same level of revenue. HY2019 saw an increase in expenses across the board, no doubt a result of the heavy level of acquisition seen in 2018.


Paragon care expenses revenue

Along with the expenses increasing, total management compensation also increased, despite earnings per share decreasing. But when we step back and look at the general compensation trend, a different story emerges. Total management compensation has increased by ~33% between 2011 and 2018, whilst Earnings per share has increased by ~30x or ~3000%. To put that another way, in 2011, 6.97% of revenue was going towards management compensation, compared with 2018’s figure of just 1.11%.


Paragon care earnings per share remuneration

Whilst management hasn’t purchased any shares recently, the last two purchases were by Brent Stewart and Geoffrey Sam around the start of December 2018, increasing their total shares held by 100,000 and 50,240 respectively. At the time of purchase, the share price was at ~$0.62, a ~40% premium on today’s prices. Not only that, but they already had quite considerable positions, at the time of purchase, their holdings were worth $1.86m and $0.91m. These two make up the bulk of the management ownership, together they own 2.2% of Paragon Care, whilst the combined management team owns only 2.9%. Not the level of skin in the game that I like to see, but not as bad as others and I have been burnt before despite large insider ownership (read about that here).

Paragon care director inside share ownership

Whilst management might not own many shares, they have paid out a pretty good dividend since its introduction in 2013. Increasing it year on year since 2013, they paid a dividend of $.0301 in 2018, which equates to a payout ratio of 57%. Assuming they continue the second half dividend increase in FY2019, they are currently trading at a dividend yield of ~7.6%, not too bad. Using the Gordon growth model with a 5% growth rate and a cost of equity of 12%, equates to a price of $0.48, a 9% gain on today’s prices.


Paragon care dividend

Evaluation

When we look at the Half year metrics, we can see a mix result, some better than HY2018 such as P/Sales and others not as good, such as Return on Assets (ROA) and Return on Equity (ROE). These numbers obviously need to be viewed lightly, since the $125m spent on acquisitions in 2018 is having a large affect on them.

Paragon care metrics value investing

Margins have declined this half, but again, this is to be expected as Paragon Care has acquired a number of companies recently and hasn’t to date, had sufficient time to bring them all into the fold. The general trend between 2015 and 2017 is however quite encouraging.

Paragon care margins

Paragon Care recently confirmed their $240m revenue and $28m EBITDA guidance, but can we trust their forecasts? One simple way to check is to go back over their past predictions and see how successful they have been. Over the last five years, Paragon Care has met and in some cases slightly exceeded all of their half year forecasts, which is quite reassuring.

Paragon care earnings profit guidance

Given their ability to forecast fiscal year results, below I have calculated possible share prices by using their forecasts and trailing 3 year EV/EBITDA multiple.  As you can see, even if they don’t quite make their FY guidance, a reduction of 5% still results in a 40% gain on today’s prices. If they can met their guidance it’s a 47% gain and 54% if they can exceed it by 5%.


Paragon care share price

Risk

Paragon Care is not without its risks. During a company roll up, whilst earnings may be increasing, many companies have a hard time converting it to cash. Matt Brazier commented on this phenomenon recently in his investment diary (link here). He stated that “Some companies' profits are subject to more approximation than others. For example, serial acquirers make more estimates and adjustments than most because buying companies is messy. Roll-up companies are also cash hungry as they must continuously buy other businesses to grow. For these reasons it is particularly important to analyse cash flow of roll-ups”. He then went on to say that “I have avoided Paragon Care Ltd (ASX:PGC) in recent years for the same reason”. On that same day, I was reading Peter Lynch’s book “Beating the Street” and he also happened to mention that an investor needs to pay more attention to cash for companies that have acquired a lot; clearly the universe was talking to me.

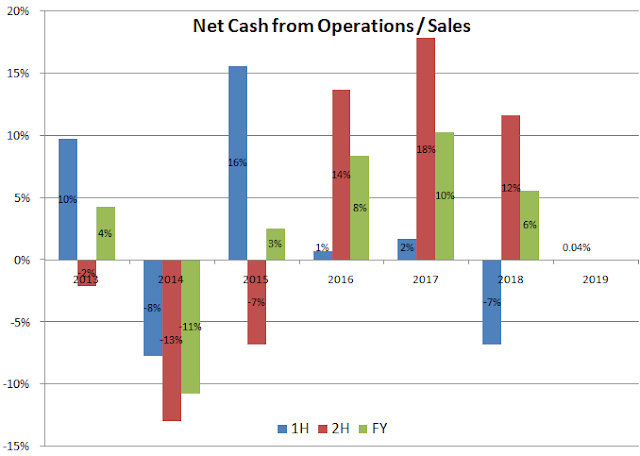
When we look at Paragon Care Net Cash from Operations by sales ratio, you can see why Mr. Brazier has stayed clear. Prior to 2016, Paragon Care has had trouble converting sales into cash, they do seem to have changed though and assuming they do turn most of the focus inwards, I imagine a more stable and healthy level of cash/sales in the future.

Paragon care cash to sales

Another thing of note, was from a recent McKinsey article titled Why the biggest and best struggle to grow which stated that whilst acquisitions “can drive a material amount of top-line growth in the relatively short order, it is now widely accepted that the average acquirer captures relatively little shareholder value from its deals. In fact, the numbers suggest that even an acquirer who consistently enjoys a top-quartile market reaction in each of its deals will create only about $0.20 in shareholder value for every $1 million in revenues acquired”, clearly not the best endorsement for the roll-up strategy. However, this is talking in generalities and about companies that are already of considerable size, as I stated earlier, the health and aged care supplier market appears to be one that is a good candidate for the roll up strategy, or is confirmation bias kicking in again?

Conclusion

Mr Simari has done an excellent job of turning a shell company with a shady past, into a health and aged care conglomerate. The choice of Mr Just to replace him and oversee the new direction of piecing all of Mr Simari’s work together seems like a good one. The market is currently growing and Paragon Care has positioned themselves to take advantage of its current fragmented state.

This investment doesn’t come without risks though, all the figures I have used are from the continuing business, the legacy business continues to drag down earnings. Even if they are able to sell it before June 30th, it would have already had a material impact on FY19. Along with this, the desire to sell could cause them to sell it off cheaper than it deserves. Another thing to think about is that within the evaluation section, I have used the 3 year trailing EV/EBITDA multiple, but are these multiples justified? The market placed those multiples on a company executing a roll up strategy, not looking inward for growth. Will the market still use such multiples, or will it place more conservative values on it in the future? I don’t know. I do however think that there are currently too many red flags for me to invest. Maybe once the FY results are released I will re think this decision, but at current prices, Paragon Care isn't offering enough return for all this uncertainty.

If you liked this and would like to read more, I have started working on a series about inflection point investing, read my first post about XRF Scientific here and the second about Korvest here and don't forget to subscribe, so you don't miss out on my upcoming posts. I am on Twitter  and Linkedin  if you’d like to connect, feel free to send me a msg, it’s always great to meet other ASX investors, especially those who have a different view point.


Thanks for reading


Just Culture Investor


Trav Mays

Sources:
The author is not a current owner of a portion of Paragon Care, they may however still be subject to one or a number of biases, more specifically anchoring and/or confirmation bias. This article is neither general nor personal advice and in no way constitutes specific or individual advice. The website and author do not guarantee, and accept no legal liability whatsoever arising from or connected to, the accuracy, reliability, currency or completeness of any material contained on this website or on any linked site. This website is not a substitute for independent professional advice and users should obtain any appropriate professional advice relevant to their particular circumstances. The material on this website may include the views or recommendations of third parties, which do not necessarily reflect the views of the website or author, or indicate its commitment to a particular course of action  

Monday 22 April 2019

Has Korvest reached an inflection point? (ASX:KOV)


Korvest evaluation galvanising

22/04/2019

Trav Mays


Continuing on our search for companies at inflection points, today we will be examining Korvest, they have been improving their results, but are they at an inflection point? Read on to find out.

Before we begin, this will be a flow on from my last post covering XRF Scientific, I highly recommend that you read that post first, it also gives a short summery of Matt Joass’ article on inflection point investing.

Company

Korvest (ASX:KOV) is a combination of 4 businesses, their most profitable is the EzyStrut cable tray manufacturer, but they also have a galvanising business in South Australia and the Power Step and Titan Technologies companies in Brisbane. Having listed in 1970, their results have been similar to all businesses tied heavily to the expenditure cycle, up and down as they ride the expenditure wave.

As the wave has been trending down in recent years, Korvest’s results have followed suit, their troubles were further exacerbated by the rising zinc prices (a key ingredient in galvanising). As you can see below (sorry about the graph, not the cleanest ever done), the price of zinc increased quite substantially between 2016 and 2017 (65.6%), whilst industry expenditure stayed fairly flat, at levels 27% lower than 2 years prior. These two forces culminated in the loss of 2017 and the ousting of the general manager Alexander Kachellek, who had overseen the business for 10 years. Please note that whist on the graph the zinc price has decreased in 2019, this is only the price until Dec 2018, it has since trended higher to ~ US$3000/tonne (As of 17/04/2019).

Korvest EBITDA zinc prices expenditure

Korvest breaks their business up into two segments, industrial products, which includes EzyStrut, Titan Technologies and Power step and Production, which includes their galvanising business. When we look at the individual segments, it’s clear that the lower expenditure is having a material impact on both segments, with the rise of zinc prices hurting the production segment even further.

Korvest segments production industrial

As with XRF, Korvest has had some tailwinds in recent years, helping to lift their profits higher. The main one is the increase in expenditure, as the old adage states, “A rising tide lifts all ships”. Another has been the decrease in zinc prices, helping to improve margins in the production segment. The lower dollar also helped Korvest, making the cheaper imported competitors more expensive.

Discussion

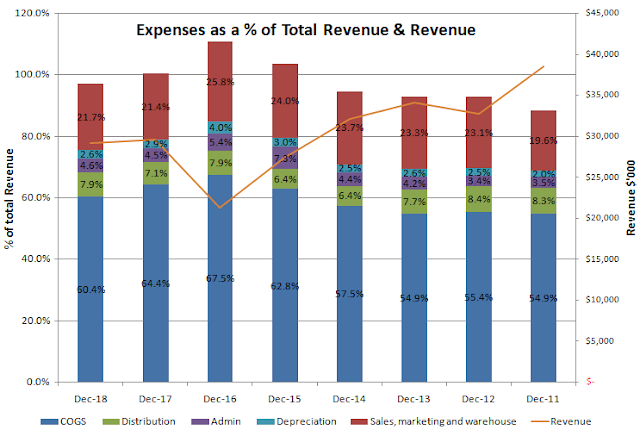
Within the XRF post, I referenced a Forbe’s interview with Peter Cuneo, in which he stated “there are three elements to a successful turnaround, cost cutting, organic growth and strategic leaps”. Unlike XRF, KOV doesn’t appear to be ticking all the boxes, expenses as a percentage of revenue have decreased, but revenue appears to have stayed fairly stable over the half, be it slightly lower. KOV have stated that they have had a number of price increases in recent years, pushing the higher zinc and energy prices onto consumers. These price increases seem justified, especially when considering the wholesale price of electricity in Adelaide has increased by 220% in 4 years (Dec 2014 31.5/MWh; Dec 2018 101/MWh) and the wholesale price of gas has increased by 219% (Dec 2014 $3.25/GJ; Dec2018 $10.37/GJ). Whilst these increases are warranted, they do however show that the slight decline in revenue must have resulted from a disproportionate decline in sales volume.

Whilst sales volumes may have decreased, a quick look at the expenses makes it appear that they have done well to reduce COGS, but the actual decrease achieved by KOV has been heavily affected by the decrease in Zinc prices. The other thing of note within the expenses, is that whilst volumes may have decreased, distribution costs have increased; increasing by 8.9% pcp (Dec 2017 $2.11 mill, Dec 2018 $2.298 million). Which could be attributed to larger and/or more difficult items to transport or rising transport costs, it’s just something of note.

Korvest expenses revenue

What about strategic leaps? Well, unfortunately KOV hasn’t ticked this box either, but that’s not from lack of trying. In 2014, KOV initiated a two part growth strategy; the first part was a further push into the export market and the second part was focusing on growth through acquisitions. To ensure they had ample manufacturing capacity to meet the predicted increase, they sold off their less profitable Indax handrail and walkway business to free up manufacturing space in their Kilburn plant for the more successful EzyStrut business.

During 2015 and 2016, KOV continued to search for potential acquisitions, their initial screen found 60 potential companies, 12 of which they spoke to and of these 12, 3 were presented indicative offers, all were unsuccessful. The 2 years of negotiating came to a total after tax cost of $475K in 2016 and a declaration that all “M&A activity paused until business conditions improve”.

During the search for acquisitions, they also focused their efforts on expanding further into the New Zealand, Philippines, Singapore and Hong Kong markets. During this time, they obtained DNV certification for their products, allowing them to be used on offshore oil and gas rigs and installed a local subsidiary in Singapore with representation. However the success of the Singaporean subsidiary was not as expected and with the margins being squeezed, KOV wrapped up the subsidiary just a year later (2017), saving ~$400K per half. Along with these growth strategies, KOV initiated a cost saving initiative, one of the areas of focus was the employee head count, reducing it by 18% in the first half of 2016 (June 2015, 225: Dec 2015, 184) and 66% from their peak 6 years prior (2010, 306).

Despite the manager director’s best efforts, he was unsuccessful in achieving the growth the board required and with the loss of 2017, it was only a matter of time before they called for his resignation. September 2017 was when he handed the reigns over to the interim CEO Chris Hartwig, who was then appointed the CEO in February. Chris has been within the Korvest group since 2006, starting off as the general manager of the galvanising business before moving to the EzyStrut business where he worked as both general manager and executive general manager.

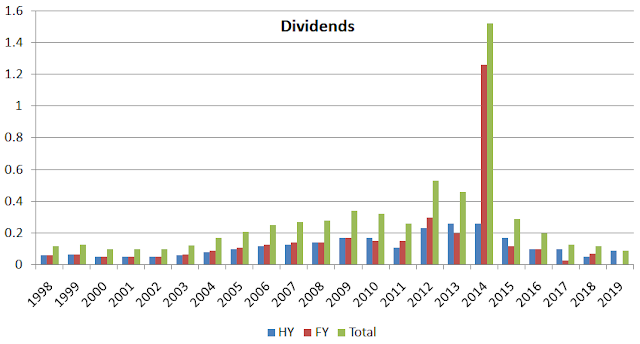
Despite the troubles Korvest has had over recent years, they have managed to continue to pay a dividend, mind you, nothing like what they paid out in 2014 (2014 includes the 100% franked special dividend of $1.00 per share). If we were to price Korvest on their dividend alone and assuming they continue to pay a second half dividend of at least equal to the first half, usually higher, but to keep it conservative, we will assume they keep it the same, Korvest has a current dividend yield of 6.67%, pretty good. Using the Gordon growth model with a growth rate of 5% and cost of equity of 12% calculates a price of $2.57 a 4.76% drop from today’s prices. 

Korvest dividend history

Given that we are (roughly) at the start of the upward phase of the expenditure cycle, is a growth rate of 5% realistic? Not really, between 2003 and 2011, Korvest increased the dividend at an average rate of 11% per year. We are however starting from a higher dividend then in 2003 (2003 .125; 2019 .18), so using a more realistic/conservative growth figure of 7, we come to a price of $3.6 a 33.33% increase on today’s price.

Evaluation

Looking at the half year value metrics, it’s clear that Korvest has posted their best half since 2014. EPS has more than doubled when compared to 2017, not only that, but they are getting a better return on both equity and assets and they are trading at an EV/EBITDA not see since 2012.

Korvest value metrics

Along with the increased return on both assets and equity, margins have continued to trend higher.

Korvest profit ebitda npat enterprise value margin gross margin

When we look at the segment PBT margin, both have increased quite considerably, production by 2% and industrial products almost doubling. Whilst still not close to the PBT margins of yesteryear, due to the changing market, I believe these types of margins have gone the way of the dodo. The increased competition across all businesses and reduced expenditure, has resulted in an abundance of unutilised production facilities, further squeezing margins. As a local manufacturer, they have had a distinct advantage against international competition, the low dollar. However, as Korvest doesn’t typically service the low cost market, this tail wind is having less of an impact than expected.

Korvest segment margin return on assets

To price Korvest, along with the Gordon Growth model above, I have tried to calculate the price at the top of the coming cycle. Korvest has achieved a FY EBITDA over $7.5mill in 3 of the last 12 years and an EBITDA over $6.5mill in 8 of the last 12 years, I have therefore used these values in my valuation as they are achievable. Using these and the 12 year average EV/EBITDA multiple of 5.8, we arrive at valuations of $4.3 and $3.73, which using today’s prices, results in a gain of 66% and 43%. Quite large gains. Given that investors typically attach higher multiplies at the top of cycles, these figures are most likely, still somewhat conservative.


Korvest segment margin return on assets price

Conclusion

If I was to invest in Korvest, it would not be as an inflection play but as a cyclical one. Whilst they have tried to decouple themselves from the Australian expenditure cycle, they have unfortunately failed. Rising fixed costs have squeezed margins in recent years and whilst some of these costs have been pushed on to consumers, an increase in the level of competition means we won’t be seeing margins similar to those seen just a few years ago anytime soon. Another thing I’m concerned about is the increase in the prices, these increases were done at a time when the Aus dollar was depressed, if/when the dollar rises back to its highs during the last cycle top, will they still be able to keep their margins and compete with the cheaper imported products? I have no idea, but my gut tells me it will be hard.

Due to all of this, and my inability to predict the cycle, let alone the top, means that I have no idea how long it will be before we see the 66 and 43 percent gains calculated above and then when you add to that the time value of money, I believe I can find better investments elsewhere, XRF scientific for example. If however you are more experience with cyclical investing, this is a good place to start your own review, worst case, you receive a pretty good dividend whilst you wait for those gains.

If you’d like to read more about inflection investing, I recommend Matt Joass’ article titled “The hidden power of inflection points” and for a company currently at or near an inflection, check out my article on XRF ScientificI am on Twitter  and Linkedin  if you’d like to connect, feel free to send me a msg, it’s always great to meet other ASX investors, especially those who have a different view point.


Thanks for reading


Just Culture Investor


Trav Mays


Sources:

The author is not a current owner of a portion of Korvest, they may however still be subject to one or a number of biases, more specifically anchoring and/or confirmation bias. This article is neither general nor personal advice and in no way constitutes specific or individual advice. The website and author do not guarantee, and accept no legal liability whatsoever arising from or connected to, the accuracy, reliability, currency or completeness of any material contained on this website or on any linked site. This website is not a substitute for independent professional advice and users should obtain any appropriate professional advice relevant to their particular circumstances. The material on this website may include the views or recommendations of third parties, which do not necessarily reflect the views of the website or author, or indicate its commitment to a particular course of action  

Thursday 11 April 2019

Has XRF Scientific reached an inflection point? (ASX:XRF)


XRF Scientific evaluation

11/04/2019

Trav Mays


XRF Scientific performed exceptionally over the half year, posting a profit greater than the FY2017 and FY2018. After a tough couple of years, they have reached an inflection point, read on to find out more.


Inflection Point

After reading Matt Joass’ article “The HiddenPower of Inflection points”, (If you haven’t already, I highly recommend you read Matt’s article and subscribe to his website, keeping you up to date with the writings of a man who has achieved quite amazing results) I have been on the lookout for a company that could be passing an inflection point.  XRF Scientific appears to be just such a company.
An inflection point, described by Investopedia as “an event that results in a significant change in the progress of a company, industry, sector, economy or geopolitical situation and can be considered a turning point after which a dramatic change, with either positive or negative results, is expected to result”. Matt within his article, goes on to name a number of different types of inflection points, luckily for us, he describes the turnaround first, which in my opinion, is where XRF are currently at. If you have read my thesis on The Reject Shop, you’ll know that I’m not a big fan of turnarounds, extremely hard to predict and as Peter Cuneo stated in an interview with Forbes “9 out of 10 turnarounds are not successful”.
As you can see on the graph below (borrowed from Matt’s article), purchasing at the inflection point typically results in a % of the gains being missed. But as value investors, we typically would have purchased somewhere along the initial price decline. How long it takes for a company, if at all, to turn back around is dependent on the situation. We could therefore be waiting years for an inflection point, with the share price continuing to trend down. Hopefully we have been averaging down during the price decline, but you need a lot of conviction to do this and I have definitely fallen victim to not believing in my valuation and selling out before the inflection point. Having said that, I have also held on too long, only to finally have my eyes opened to the mistake I made far too late. Blasted anchoring and confirmation biases! (Read about an example of this here).

XRF Scientific inflection point investing

The benefits to such a style of investing really resonates with me and not only that, it has some heavy hitters using it. Howard Marks wrote this in his memo titled “Dare to be great II”, “Being too far ahead of your time is indistinguishable from being wrong. The fact that something’s cheap doesn’t mean it’s going to appreciate tomorrow; it can languish in the bargain basement. And the fact that something’s overpriced certainly doesn’t mean it’ll fall right away; bull markets can go on for years. As Lord Keynes observed, “the market can remain irrational longer than you can remain solvent.””

Not only will purchasing at an inflection point reduce time induced errors, but it has a record of performing exceptionally. A strategy using both value and momentum was one of the best strategies within Jim O’Shaughnessy’s book What Works on Wall Street 4th edition” (named the trending value portfolio in the book). It achieved a geometric average return of 21.19% between 1964 and 2009 (45 years). Not only that, it had a Sharpe ratio of .93 and bested the All Stocks index in 99% of all rolling 3 year periods and 100% of all 5,7 and 10 rolling year periods! Absolutely amazing results. To achieve this, Mr. O’Shaughnessy screened out the top 10% (Decile 1) of the all stock index, using 6 value metrics (P/B, P/E,P/S, EBITDA/EV,P/CF & Shareholder yield) and from these he selected the top 25 stocks with the highest 6 month price appreciation. By using this strategy, he inadvertently (I’m sure this was his goal or at least part of it) selected companies that are on their way to recovery or saying it another way, were at or near their inflection point.

Reading Matt’s article for me was an "Ah Ha" moment, putting a whole lot of pieces together and completing the picture. Anyway, I digress, you clicked here to read my analysis on XRF Scientific, so here it is.

Company

XRF Scientific (ASX:XRF) is an Australian listed, Perth Based, scientific equipment and chemical manufacturer with support facilities in Perth, Melbourne, Europe, Canada and a global distribution network. They operate using the razor blade business model, whereby they sell the scientific equipment at a low margin (2018 PBT margin 7%) in order to increase sales in their high margin (2018 PBT margin 27%) consumables division (margins can be seen in the evaluation section below).

XRF breaks their business down into three segments, Capital Equipment, Precious Metals and Consumables. The Capital Equipment segment includes the design, manufacture and service of specialised fusion and laboratory equipment, whilst the Precious Metals division manufactures products for the platinum alloy markets and the Consumables segment producers and distributes chemicals and other supplies for analytical laboratories.

Discussion

Within Peter Cuneo’s Forbe’s interview, he states that “there are three elements to a successful turnaround, cost cutting, organic growth and strategic leaps”. I believe that XRF has either achieved,  or are on their way to achieving all three. As you can see below, XRF since 2016 has been reducing their expenses as a percentage of revenue, whilst simultaneously increasing their revenue (64% gain in revenue between 2015 and 2019). They have also increased their profit margin whilst keeping the gross margin steady at 39% (See table in Evaluation section), that’s the first two elements covered.

XRF Scientific expenses revenue evaluation

What about the strategic leaps? Well XRF’s expansion (strategic leap) in the Precious Metals Division is beginning to bear fruit. The plan, originally announced in October 2015, was to expand the Precious Metals division into the overseas market, with the first step being a new Melbourne manufacturing factory with upgraded equipment; the investment totalled $3.3m. The added production capacity allowed XRF to open their first European office in Germany, working as a distribution hub for the European market. The German office has recently record their first profit, $5k in January 2019, with XRF predicting it to produce a “material impact” to the group’s profits within the next 1 – 2 years.

When we look at the individual segments profit before tax, we can see that both capital equipment and precious metals got hit pretty hard in 2016 and 2017. These results were from a combination of factors, the new German office, the relocation of the manufacturing facility, lower investment in mining, uncertainty around the US election, and an increasing in lithium prices.

XRF Scientific segment breakdown profit before tax PBT

The slowdown of the investment in the mining sector hit XRF especially hard, see below, as the mining sector accounted for 70 - 80% of XRF’s profits at the time. They have since reduced this to 58%, helping to diminish the impact of mining’s cyclical nature.

XRF Scientific profit vs. mining expenditure

Whilst the profit before tax has been trending upwards in recent years, this is not a result that has come purely from exceptional management; they have had some tail winds. One such tail wind is the reduced price of lithium, as a component within some of the consumable products, this decrease helps to lift margins. Another has been the increase in mining expenditure in plant and equipment in recent years. Along with those tail winds, XRF has spent just over $3.44 million on acquisitions over the last 6 years, clearly this along with the tail winds stated, have been helping fill XRF’s sails.

Evaluation

Looking at XRF’s half yearly metrics, it’s clear that they have been improving on all fronts since their disappointing 2016 result. As an owner, we are currently getting a larger slice of the revenue and profit for our money, not only that, but XRF is currently running the business better, both Return On Assets and Return On Equity are trending higher. Along with this, for the first half of FY2019, XRF has achieved a Pitroski score of 7 (not within the table), losing points for the current ratio being lower than 2017 (2.64 HY2019; 2.98 HY2018) and Gross margin not being higher than 2017 (39.2% HY2019; 39.4% HY2018).

XRF Scientific half year value metrics

Not only are they improving the value metrics, but they have been improving margins as well, with all margins, except gross margin, trending higher.

XRF Scientific half year margins profit NPAT gross margin

Breaking it down further into segments, you can see that the Profit Before Tax margin along with the ROA’s is trending up for all 3 segments.

XRF Scientific segment profit before tax return on assets

To come up with an evaluation of XRF, I have assumed that there is no growth within the second half of 2019, they have generated 50% of the FY EBITDA within the first half (48.6% 2018 & 47.7% 2017), and have used the average EV/EBITDA margin from the last 6 years. This gives us a share price of $0.24, a 42% gain on the price at writing.

XRF Scientific share price evaluation

Is the no growth in the second half of FY2019 a reasonable assumption, I don’t think so. As you can see below, the German office has been increasing their revenue per half consistently over the last 2 years. Along with this, there has been a revived growth in mining activities across the globe and the (hopefully) continue negative trend of the lithium price. I therefore believe that the share price of $0.24 is conservative, given this and the already 42% gain, I believe that XRF scientific will make a great addition to my portfolio.

XRF Scientific german office profit revenue

Whilst not affecting the above analysis, but something to keep in mind is that not only is the German office increasing revenue, they are improving the bottom line as well. In the first half of 2019, the German office made a total contribution of -$247,152, but then went on to make their first profit in January 2019; $5k. I don’t think that they will necessarily make a profit for the whole of the second half when looked at alone, but when the benefit to the other XRF divisions is added to it, I believe if it doesn't break even, it will be very close. The progress the German office has been making to get to breakeven over the last 2 years helps confirm this assumption. Below, I have graphed the German office profit along with the % change. As you can see, they decreased their loss in 1H 2019 by 34% pcp, to achieve this, they increased revenue by 43% whilst expenses only grew by 18.5%.

XRF Scientific german office profit

Conclusion

XRF appears to be at an inflection point, they have diversified themselves from the mining industry, expanded to a larger manufacturing facility, opened a German distribution hub that has just become profitable, increased profit margins across the board, increased revenue, reduced expenses, have taken strategic leaps and just posted a half year profit, higher than FY2017 & FY2018. All this and they are currently trading at lower market cap than the last 6 years. Peter Cuneo said “there are three elements to a successful turnaround”, XRF, in my opinion, has achieved all three. I am on Twitter  and Linkedin  if you’d like to connect, feel free to send me a msg, it’s always great to meet other ASX investors, especially those who have a different view point.


Thanks for reading


Just Culture Investor


Trav Mays

Sources:

The author is a current owner of a portion of XRF Scientific, given this, they may be subject to one or a number of biases, more specifically anchoring and/or confirmation bias. This article is neither general nor personal advice and in no way constitutes specific or individual advice. The website and author do not guarantee, and accept no legal liability whatsoever arising from or connected to, the accuracy, reliability, currency or completeness of any material contained on this website or on any linked site. This website is not a substitute for independent professional advice and users should obtain any appropriate professional advice relevant to their particular circumstances. The material on this website may include the views or recommendations of third parties, which do not necessarily reflect the views of the website or author, or indicate its commitment to a particular course of action  
Subscribe

* indicates required

Intuit Mailchimp

Latest post

New Site