Applying Just Culture to improve investment decisions

Monday, 22 April 2019

Has Korvest reached an inflection point? (ASX:KOV)


Korvest evaluation galvanising

22/04/2019

Trav Mays


Continuing on our search for companies at inflection points, today we will be examining Korvest, they have been improving their results, but are they at an inflection point? Read on to find out.

Before we begin, this will be a flow on from my last post covering XRF Scientific, I highly recommend that you read that post first, it also gives a short summery of Matt Joass’ article on inflection point investing.

Company

Korvest (ASX:KOV) is a combination of 4 businesses, their most profitable is the EzyStrut cable tray manufacturer, but they also have a galvanising business in South Australia and the Power Step and Titan Technologies companies in Brisbane. Having listed in 1970, their results have been similar to all businesses tied heavily to the expenditure cycle, up and down as they ride the expenditure wave.

As the wave has been trending down in recent years, Korvest’s results have followed suit, their troubles were further exacerbated by the rising zinc prices (a key ingredient in galvanising). As you can see below (sorry about the graph, not the cleanest ever done), the price of zinc increased quite substantially between 2016 and 2017 (65.6%), whilst industry expenditure stayed fairly flat, at levels 27% lower than 2 years prior. These two forces culminated in the loss of 2017 and the ousting of the general manager Alexander Kachellek, who had overseen the business for 10 years. Please note that whist on the graph the zinc price has decreased in 2019, this is only the price until Dec 2018, it has since trended higher to ~ US$3000/tonne (As of 17/04/2019).

Korvest EBITDA zinc prices expenditure

Korvest breaks their business up into two segments, industrial products, which includes EzyStrut, Titan Technologies and Power step and Production, which includes their galvanising business. When we look at the individual segments, it’s clear that the lower expenditure is having a material impact on both segments, with the rise of zinc prices hurting the production segment even further.

Korvest segments production industrial

As with XRF, Korvest has had some tailwinds in recent years, helping to lift their profits higher. The main one is the increase in expenditure, as the old adage states, “A rising tide lifts all ships”. Another has been the decrease in zinc prices, helping to improve margins in the production segment. The lower dollar also helped Korvest, making the cheaper imported competitors more expensive.

Discussion

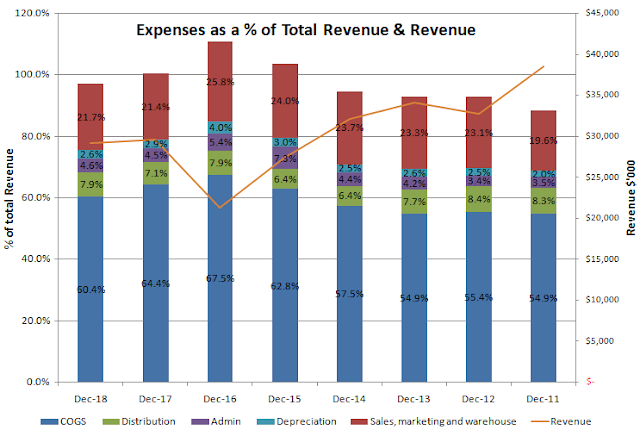
Within the XRF post, I referenced a Forbe’s interview with Peter Cuneo, in which he stated “there are three elements to a successful turnaround, cost cutting, organic growth and strategic leaps”. Unlike XRF, KOV doesn’t appear to be ticking all the boxes, expenses as a percentage of revenue have decreased, but revenue appears to have stayed fairly stable over the half, be it slightly lower. KOV have stated that they have had a number of price increases in recent years, pushing the higher zinc and energy prices onto consumers. These price increases seem justified, especially when considering the wholesale price of electricity in Adelaide has increased by 220% in 4 years (Dec 2014 31.5/MWh; Dec 2018 101/MWh) and the wholesale price of gas has increased by 219% (Dec 2014 $3.25/GJ; Dec2018 $10.37/GJ). Whilst these increases are warranted, they do however show that the slight decline in revenue must have resulted from a disproportionate decline in sales volume.

Whilst sales volumes may have decreased, a quick look at the expenses makes it appear that they have done well to reduce COGS, but the actual decrease achieved by KOV has been heavily affected by the decrease in Zinc prices. The other thing of note within the expenses, is that whilst volumes may have decreased, distribution costs have increased; increasing by 8.9% pcp (Dec 2017 $2.11 mill, Dec 2018 $2.298 million). Which could be attributed to larger and/or more difficult items to transport or rising transport costs, it’s just something of note.

Korvest expenses revenue

What about strategic leaps? Well, unfortunately KOV hasn’t ticked this box either, but that’s not from lack of trying. In 2014, KOV initiated a two part growth strategy; the first part was a further push into the export market and the second part was focusing on growth through acquisitions. To ensure they had ample manufacturing capacity to meet the predicted increase, they sold off their less profitable Indax handrail and walkway business to free up manufacturing space in their Kilburn plant for the more successful EzyStrut business.

During 2015 and 2016, KOV continued to search for potential acquisitions, their initial screen found 60 potential companies, 12 of which they spoke to and of these 12, 3 were presented indicative offers, all were unsuccessful. The 2 years of negotiating came to a total after tax cost of $475K in 2016 and a declaration that all “M&A activity paused until business conditions improve”.

During the search for acquisitions, they also focused their efforts on expanding further into the New Zealand, Philippines, Singapore and Hong Kong markets. During this time, they obtained DNV certification for their products, allowing them to be used on offshore oil and gas rigs and installed a local subsidiary in Singapore with representation. However the success of the Singaporean subsidiary was not as expected and with the margins being squeezed, KOV wrapped up the subsidiary just a year later (2017), saving ~$400K per half. Along with these growth strategies, KOV initiated a cost saving initiative, one of the areas of focus was the employee head count, reducing it by 18% in the first half of 2016 (June 2015, 225: Dec 2015, 184) and 66% from their peak 6 years prior (2010, 306).

Despite the manager director’s best efforts, he was unsuccessful in achieving the growth the board required and with the loss of 2017, it was only a matter of time before they called for his resignation. September 2017 was when he handed the reigns over to the interim CEO Chris Hartwig, who was then appointed the CEO in February. Chris has been within the Korvest group since 2006, starting off as the general manager of the galvanising business before moving to the EzyStrut business where he worked as both general manager and executive general manager.

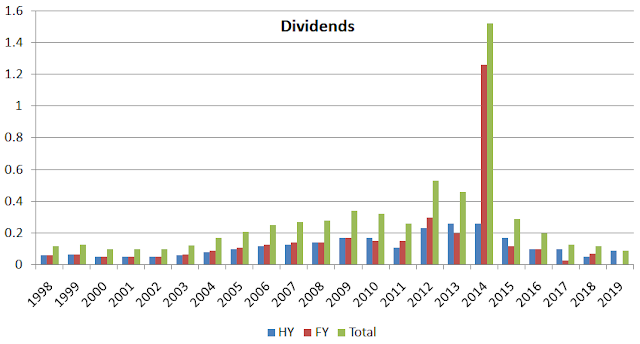
Despite the troubles Korvest has had over recent years, they have managed to continue to pay a dividend, mind you, nothing like what they paid out in 2014 (2014 includes the 100% franked special dividend of $1.00 per share). If we were to price Korvest on their dividend alone and assuming they continue to pay a second half dividend of at least equal to the first half, usually higher, but to keep it conservative, we will assume they keep it the same, Korvest has a current dividend yield of 6.67%, pretty good. Using the Gordon growth model with a growth rate of 5% and cost of equity of 12% calculates a price of $2.57 a 4.76% drop from today’s prices. 

Korvest dividend history

Given that we are (roughly) at the start of the upward phase of the expenditure cycle, is a growth rate of 5% realistic? Not really, between 2003 and 2011, Korvest increased the dividend at an average rate of 11% per year. We are however starting from a higher dividend then in 2003 (2003 .125; 2019 .18), so using a more realistic/conservative growth figure of 7, we come to a price of $3.6 a 33.33% increase on today’s price.

Evaluation

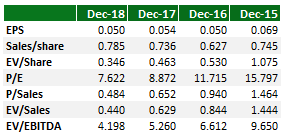
Looking at the half year value metrics, it’s clear that Korvest has posted their best half since 2014. EPS has more than doubled when compared to 2017, not only that, but they are getting a better return on both equity and assets and they are trading at an EV/EBITDA not see since 2012.

Korvest value metrics

Along with the increased return on both assets and equity, margins have continued to trend higher.

Korvest profit ebitda npat enterprise value margin gross margin

When we look at the segment PBT margin, both have increased quite considerably, production by 2% and industrial products almost doubling. Whilst still not close to the PBT margins of yesteryear, due to the changing market, I believe these types of margins have gone the way of the dodo. The increased competition across all businesses and reduced expenditure, has resulted in an abundance of unutilised production facilities, further squeezing margins. As a local manufacturer, they have had a distinct advantage against international competition, the low dollar. However, as Korvest doesn’t typically service the low cost market, this tail wind is having less of an impact than expected.

Korvest segment margin return on assets

To price Korvest, along with the Gordon Growth model above, I have tried to calculate the price at the top of the coming cycle. Korvest has achieved a FY EBITDA over $7.5mill in 3 of the last 12 years and an EBITDA over $6.5mill in 8 of the last 12 years, I have therefore used these values in my valuation as they are achievable. Using these and the 12 year average EV/EBITDA multiple of 5.8, we arrive at valuations of $4.3 and $3.73, which using today’s prices, results in a gain of 66% and 43%. Quite large gains. Given that investors typically attach higher multiplies at the top of cycles, these figures are most likely, still somewhat conservative.


Korvest segment margin return on assets price

Conclusion

If I was to invest in Korvest, it would not be as an inflection play but as a cyclical one. Whilst they have tried to decouple themselves from the Australian expenditure cycle, they have unfortunately failed. Rising fixed costs have squeezed margins in recent years and whilst some of these costs have been pushed on to consumers, an increase in the level of competition means we won’t be seeing margins similar to those seen just a few years ago anytime soon. Another thing I’m concerned about is the increase in the prices, these increases were done at a time when the Aus dollar was depressed, if/when the dollar rises back to its highs during the last cycle top, will they still be able to keep their margins and compete with the cheaper imported products? I have no idea, but my gut tells me it will be hard.

Due to all of this, and my inability to predict the cycle, let alone the top, means that I have no idea how long it will be before we see the 66 and 43 percent gains calculated above and then when you add to that the time value of money, I believe I can find better investments elsewhere, XRF scientific for example. If however you are more experience with cyclical investing, this is a good place to start your own review, worst case, you receive a pretty good dividend whilst you wait for those gains.

If you’d like to read more about inflection investing, I recommend Matt Joass’ article titled “The hidden power of inflection points” and for a company currently at or near an inflection, check out my article on XRF ScientificI am on Twitter  and Linkedin  if you’d like to connect, feel free to send me a msg, it’s always great to meet other ASX investors, especially those who have a different view point.


Thanks for reading


Just Culture Investor


Trav Mays


Sources:

The author is not a current owner of a portion of Korvest, they may however still be subject to one or a number of biases, more specifically anchoring and/or confirmation bias. This article is neither general nor personal advice and in no way constitutes specific or individual advice. The website and author do not guarantee, and accept no legal liability whatsoever arising from or connected to, the accuracy, reliability, currency or completeness of any material contained on this website or on any linked site. This website is not a substitute for independent professional advice and users should obtain any appropriate professional advice relevant to their particular circumstances. The material on this website may include the views or recommendations of third parties, which do not necessarily reflect the views of the website or author, or indicate its commitment to a particular course of action  

Thursday, 11 April 2019

Has XRF Scientific reached an inflection point? (ASX:XRF)


XRF Scientific evaluation

11/04/2019

Trav Mays


XRF Scientific performed exceptionally over the half year, posting a profit greater than the FY2017 and FY2018. After a tough couple of years, they have reached an inflection point, read on to find out more.


Inflection Point

After reading Matt Joass’ article “The HiddenPower of Inflection points”, (If you haven’t already, I highly recommend you read Matt’s article and subscribe to his website, keeping you up to date with the writings of a man who has achieved quite amazing results) I have been on the lookout for a company that could be passing an inflection point.  XRF Scientific appears to be just such a company.
An inflection point, described by Investopedia as “an event that results in a significant change in the progress of a company, industry, sector, economy or geopolitical situation and can be considered a turning point after which a dramatic change, with either positive or negative results, is expected to result”. Matt within his article, goes on to name a number of different types of inflection points, luckily for us, he describes the turnaround first, which in my opinion, is where XRF are currently at. If you have read my thesis on The Reject Shop, you’ll know that I’m not a big fan of turnarounds, extremely hard to predict and as Peter Cuneo stated in an interview with Forbes “9 out of 10 turnarounds are not successful”.
As you can see on the graph below (borrowed from Matt’s article), purchasing at the inflection point typically results in a % of the gains being missed. But as value investors, we typically would have purchased somewhere along the initial price decline. How long it takes for a company, if at all, to turn back around is dependent on the situation. We could therefore be waiting years for an inflection point, with the share price continuing to trend down. Hopefully we have been averaging down during the price decline, but you need a lot of conviction to do this and I have definitely fallen victim to not believing in my valuation and selling out before the inflection point. Having said that, I have also held on too long, only to finally have my eyes opened to the mistake I made far too late. Blasted anchoring and confirmation biases! (Read about an example of this here).

XRF Scientific inflection point investing

The benefits to such a style of investing really resonates with me and not only that, it has some heavy hitters using it. Howard Marks wrote this in his memo titled “Dare to be great II”, “Being too far ahead of your time is indistinguishable from being wrong. The fact that something’s cheap doesn’t mean it’s going to appreciate tomorrow; it can languish in the bargain basement. And the fact that something’s overpriced certainly doesn’t mean it’ll fall right away; bull markets can go on for years. As Lord Keynes observed, “the market can remain irrational longer than you can remain solvent.””

Not only will purchasing at an inflection point reduce time induced errors, but it has a record of performing exceptionally. A strategy using both value and momentum was one of the best strategies within Jim O’Shaughnessy’s book What Works on Wall Street 4th edition” (named the trending value portfolio in the book). It achieved a geometric average return of 21.19% between 1964 and 2009 (45 years). Not only that, it had a Sharpe ratio of .93 and bested the All Stocks index in 99% of all rolling 3 year periods and 100% of all 5,7 and 10 rolling year periods! Absolutely amazing results. To achieve this, Mr. O’Shaughnessy screened out the top 10% (Decile 1) of the all stock index, using 6 value metrics (P/B, P/E,P/S, EBITDA/EV,P/CF & Shareholder yield) and from these he selected the top 25 stocks with the highest 6 month price appreciation. By using this strategy, he inadvertently (I’m sure this was his goal or at least part of it) selected companies that are on their way to recovery or saying it another way, were at or near their inflection point.

Reading Matt’s article for me was an "Ah Ha" moment, putting a whole lot of pieces together and completing the picture. Anyway, I digress, you clicked here to read my analysis on XRF Scientific, so here it is.

Company

XRF Scientific (ASX:XRF) is an Australian listed, Perth Based, scientific equipment and chemical manufacturer with support facilities in Perth, Melbourne, Europe, Canada and a global distribution network. They operate using the razor blade business model, whereby they sell the scientific equipment at a low margin (2018 PBT margin 7%) in order to increase sales in their high margin (2018 PBT margin 27%) consumables division (margins can be seen in the evaluation section below).

XRF breaks their business down into three segments, Capital Equipment, Precious Metals and Consumables. The Capital Equipment segment includes the design, manufacture and service of specialised fusion and laboratory equipment, whilst the Precious Metals division manufactures products for the platinum alloy markets and the Consumables segment producers and distributes chemicals and other supplies for analytical laboratories.

Discussion

Within Peter Cuneo’s Forbe’s interview, he states that “there are three elements to a successful turnaround, cost cutting, organic growth and strategic leaps”. I believe that XRF has either achieved,  or are on their way to achieving all three. As you can see below, XRF since 2016 has been reducing their expenses as a percentage of revenue, whilst simultaneously increasing their revenue (64% gain in revenue between 2015 and 2019). They have also increased their profit margin whilst keeping the gross margin steady at 39% (See table in Evaluation section), that’s the first two elements covered.

XRF Scientific expenses revenue evaluation

What about the strategic leaps? Well XRF’s expansion (strategic leap) in the Precious Metals Division is beginning to bear fruit. The plan, originally announced in October 2015, was to expand the Precious Metals division into the overseas market, with the first step being a new Melbourne manufacturing factory with upgraded equipment; the investment totalled $3.3m. The added production capacity allowed XRF to open their first European office in Germany, working as a distribution hub for the European market. The German office has recently record their first profit, $5k in January 2019, with XRF predicting it to produce a “material impact” to the group’s profits within the next 1 – 2 years.

When we look at the individual segments profit before tax, we can see that both capital equipment and precious metals got hit pretty hard in 2016 and 2017. These results were from a combination of factors, the new German office, the relocation of the manufacturing facility, lower investment in mining, uncertainty around the US election, and an increasing in lithium prices.

XRF Scientific segment breakdown profit before tax PBT

The slowdown of the investment in the mining sector hit XRF especially hard, see below, as the mining sector accounted for 70 - 80% of XRF’s profits at the time. They have since reduced this to 58%, helping to diminish the impact of mining’s cyclical nature.

XRF Scientific profit vs. mining expenditure

Whilst the profit before tax has been trending upwards in recent years, this is not a result that has come purely from exceptional management; they have had some tail winds. One such tail wind is the reduced price of lithium, as a component within some of the consumable products, this decrease helps to lift margins. Another has been the increase in mining expenditure in plant and equipment in recent years. Along with those tail winds, XRF has spent just over $3.44 million on acquisitions over the last 6 years, clearly this along with the tail winds stated, have been helping fill XRF’s sails.

Evaluation

Looking at XRF’s half yearly metrics, it’s clear that they have been improving on all fronts since their disappointing 2016 result. As an owner, we are currently getting a larger slice of the revenue and profit for our money, not only that, but XRF is currently running the business better, both Return On Assets and Return On Equity are trending higher. Along with this, for the first half of FY2019, XRF has achieved a Pitroski score of 7 (not within the table), losing points for the current ratio being lower than 2017 (2.64 HY2019; 2.98 HY2018) and Gross margin not being higher than 2017 (39.2% HY2019; 39.4% HY2018).

XRF Scientific half year value metrics

Not only are they improving the value metrics, but they have been improving margins as well, with all margins, except gross margin, trending higher.

XRF Scientific half year margins profit NPAT gross margin

Breaking it down further into segments, you can see that the Profit Before Tax margin along with the ROA’s is trending up for all 3 segments.

XRF Scientific segment profit before tax return on assets

To come up with an evaluation of XRF, I have assumed that there is no growth within the second half of 2019, they have generated 50% of the FY EBITDA within the first half (48.6% 2018 & 47.7% 2017), and have used the average EV/EBITDA margin from the last 6 years. This gives us a share price of $0.24, a 42% gain on the price at writing.

XRF Scientific share price evaluation

Is the no growth in the second half of FY2019 a reasonable assumption, I don’t think so. As you can see below, the German office has been increasing their revenue per half consistently over the last 2 years. Along with this, there has been a revived growth in mining activities across the globe and the (hopefully) continue negative trend of the lithium price. I therefore believe that the share price of $0.24 is conservative, given this and the already 42% gain, I believe that XRF scientific will make a great addition to my portfolio.

XRF Scientific german office profit revenue

Whilst not affecting the above analysis, but something to keep in mind is that not only is the German office increasing revenue, they are improving the bottom line as well. In the first half of 2019, the German office made a total contribution of -$247,152, but then went on to make their first profit in January 2019; $5k. I don’t think that they will necessarily make a profit for the whole of the second half when looked at alone, but when the benefit to the other XRF divisions is added to it, I believe if it doesn't break even, it will be very close. The progress the German office has been making to get to breakeven over the last 2 years helps confirm this assumption. Below, I have graphed the German office profit along with the % change. As you can see, they decreased their loss in 1H 2019 by 34% pcp, to achieve this, they increased revenue by 43% whilst expenses only grew by 18.5%.

XRF Scientific german office profit

Conclusion

XRF appears to be at an inflection point, they have diversified themselves from the mining industry, expanded to a larger manufacturing facility, opened a German distribution hub that has just become profitable, increased profit margins across the board, increased revenue, reduced expenses, have taken strategic leaps and just posted a half year profit, higher than FY2017 & FY2018. All this and they are currently trading at lower market cap than the last 6 years. Peter Cuneo said “there are three elements to a successful turnaround”, XRF, in my opinion, has achieved all three. I am on Twitter  and Linkedin  if you’d like to connect, feel free to send me a msg, it’s always great to meet other ASX investors, especially those who have a different view point.


Thanks for reading


Just Culture Investor


Trav Mays

Sources:

The author is a current owner of a portion of XRF Scientific, given this, they may be subject to one or a number of biases, more specifically anchoring and/or confirmation bias. This article is neither general nor personal advice and in no way constitutes specific or individual advice. The website and author do not guarantee, and accept no legal liability whatsoever arising from or connected to, the accuracy, reliability, currency or completeness of any material contained on this website or on any linked site. This website is not a substitute for independent professional advice and users should obtain any appropriate professional advice relevant to their particular circumstances. The material on this website may include the views or recommendations of third parties, which do not necessarily reflect the views of the website or author, or indicate its commitment to a particular course of action  

Sunday, 10 March 2019

Soldiering on, Shaver Shop half year results (ASX:SSG)

SHAVER SHOP HALF YEAR RESULTS

10/03/2019

Trav Mays


Today we will be diving into Shaver Shop’s 2019 half year results, some good, some not so good, but if you’ve read my initial thesis, the results are as you’d expect, fairly average.


Before we begin, here is a refresher on Shaver Shop, click here.

HY Report

Shaver Shop has a mixed start to the fiscal year, they achieved a 7.7% increase in sales (ex. Daigou), with online sales increasing a further 10.6% (1H 2018 66.6%) to now form 12% of total sales. This sounds great, but then you continue on and see that they actually increased their store count to 113 (7 stores in 6 months) and their like for like store sales decreased by 5% (flat if you exclude Daigou re-sellers).

SHAVER SHOP HALF YEAR RESULTS
Another half year achievement was the increase in the gross margin of 1.3% to 42.7%, which is a total 5 year percentage change of 3%, very impressive considering how much Shaver Shop has expanded over those years and the reduced Aussie dollar. Unfortunately, whilst they may be having success in reducing cost of goods sold, their other expenses are increasing disproportionately to revenue. As you look down the margin table below, you can see that all of the other margins are decreasing year on year, with Net Profit After Tax (NPAT) decreasing 1% pcp, taking the total 5 year percentage change to -32.7%.

SHAVER SHOP HALF YEAR RESULTS

When we breakdown the expenses and calculate them as a percentage of total revenue, the increasing culprits are, employee wages, 2.1%, occupancy, .5%, and other expenses, 1.2%. Marketing continues to be the area Shaver Shop is targeting their cost cutting, reducing by another 1.2% pcp (just over a $1mill) and halving over the last 5 years.
SHAVER SHOP HALF YEAR RESULTS

Shaver Shop stated in their conference call, that they are moving away from the more traditional and expensive advertising mediums (television, print, etc.), towards the cheaper online marketing campaigns, which can explain some of the reduction in their marketing spend. I understand their desire to reduce this expense, it’s an easy one to reduce with little revenue impact over the short term (it does help their margins as well), but as competition increases, they need to be differentiating themselves from other companies, especially online, such as Amazon. Why would a customer choose to go to their website, what advantage do they offer in this space? In store is a different story, they have a consistently high Net Promoter Score (NPS), but as customers are becoming more sophisticated, many doing their own research before even setting foot in the store, this competitive advantage will be eroded away. Consumers are obviously moving towards online, Shaver Shop can see this move and are therefore promoting online more, but again, what can they offer a potential customer that Amazon or another big retailer can’t, a bigger discount? Fast delivery (Good luck beating Amazon on this one)? A simple to use website, with a streamlined purchase process and a limited number of purchase pain points? None of these or others I can think off gives Shaver Shop any advantage over other online websites, in my opinion they have no online competitive advantage.

Evaluation

The reject shop on a number of metrics, see below, is trading at historical lows, making it appear to be a good buy. Interestingly, the trend over the years has been downward, this means when looking at the numbers alone, there has never been a better time to buy Shaver Shop.

SHAVER SHOP HALF YEAR RESULTS

On a historical 7 year Enterprise multiple, shaver shop appears to have ~19.8% upside potential, which when added to the ~10% dividend yield, is a pretty healthy return.

SHAVER SHOP HALF YEAR RESULTS

As I believe Shaver Shop has become a dividend stock, with little chance of future growth, I have also included the Gordon Growth Model in this evaluation. For those unfamiliar with the Gordon Growth Model, it is a simple formula for evaluating the price of a stock using its dividend and the potential shareholders required return. It does however have a number of large limitations, it assumes the growth rate goes on forever, that a potential shareholders rate of return doesn’t change over time and doesn’t take into account the time value of money. There are more complex versions which overcome some of these limitations, but if you keep them in mind, it works as a quick and easy evaluation technique.
SHAVER SHOP HALF YEAR RESULTS

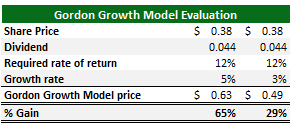
As you can see below, assuming that Shaver Shop continues to payout a $.024 dividend in the second half and using growth rates of 5 (roughly the dividend growth rate over the last 2 years) and 3 percent, we calculate a share prices offering a 65 and 29 percent increase on today’s values. Quite encouraging, but are these growth rates achievable over the long run? When doing the final overview of the evaluation results, I wouldn’t put too much weight on this one. 

SHAVER SHOP HALF YEAR RESULTS


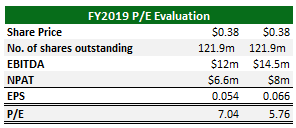
Using Shaver Shop’s FY2019 EBITDA guidance and the historical NPAT/EBITDA ratio, we can calculate possible EPS for FY2019 and using this, see what P/E the share is currently trading at. Below you can see that assuming we have no large hiccups, Shaver Shop is currently trading at between a 5.5 and 7.5 P/E ratio, quite low, but in my opinion not too far off where I would expect them to be.

SHAVER SHOP HALF YEAR RESULTS

Discussion

Using historical references, Shaver Shop is currently looking cheap, but with the limited growth opportunity available, it appears about right. They did look at an acquisition over the half, rumoured to be Hairhouse Warehouse, which after costing them $1mill in due diligence, they decided against it. I’m sure that they made the right choice, but instead of looking for further growth opportunities, they have decided to increase the dividend payout ratio and suspend share buybacks (Somewhat contrarian to other companies willing to buy back their stock at any price, but further cements my opinion that they are currently priced roughly right). During the conference call, an investor asked if they would be looking at other potential acquisitions, with Shaver Shop stating (not exact quote) that if a very obvious buy hit them in the face, they would obviously purchase, but they are not currently looking. Which is a shame, a growth plan (along with the increase in stores) would be great, even if it isn’t an acquisition, maybe something like focusing on expanding into NZ market more could be a good option. Anything would be good, they are nearing the top of the number of stores Australia can handle, having already started to talk about store cannibalisation (the close proximity of stores, moves sales from one store to another). Obviously this is something all retail companies need to worry about, but I didn’t think this would be something they needed to worry too much about this far away from their goal of 145 stores.

The real question is what is Shaver Shops competitive advantage (moat)? In store they have excellent customer service. But as many customers are doing their own research before entering the store, for a large number of customers, the store is just the place they purchase the product they had already mentally purchased before setting foot in store. The future is online and here I really struggle to see what they can offer over other online stores, especially ones without brick and mortar stores, with low fixed costs and therefore larger margins. For a long time to come, there will always be people who enjoy the brick and mortar experience, but as this number is dwindling, so too will Shaver Shop’s advantage.

Conclusion

Shaver Shop on the face of it looks like a screaming buy, but when you step back from the numbers and look at the whole landscape I believe that they are priced about right. They are an excellent dividend stock, having increased their payout ratio of cash NPAT from 50% to between 60 – 80%, but with little growth opportunities and the decrease in available funds, I believe they will continue to shoulder on, paying out a great dividend over the short to medium term, until they can’t anymore.

If you would like to read another retail HY report, check out my recent Cellnet article hereI am on Twitter  and Linkedin  if you’d like to connect, feel free to send me a msg, it’s always great to meet other ASX investors, especially those who have a different view point.


Thanks for reading


Just Culture Investor


Trav Mays


The author is a current owner of a portion of Shaver Shop, given this, they may be subject to one or a number of biases, more specifically anchoring and/or confirmation bias. This article is neither general nor personal advice and in no way constitutes specific or individual advice. The website and author do not guarantee, and accept no legal liability whatsoever arising from or connected to, the accuracy, reliability, currency or completeness of any material contained on this website or on any linked site. This website is not a substitute for independent professional advice and users should obtain any appropriate professional advice relevant to their particular circumstances. The material on this website may include the views or recommendations of third parties, which do not necessarily reflect the views of the website or author, or indicate its commitment to a particular course of action  

Monday, 4 March 2019

You can’t predict. You can Prepare; Cellnet HY update (ASX:CLT)


cellnet forecast results

04/03/2019

Trav Mays


Today we will be examining Cellnet’s HY2019 results; a recent drop in share price of roughly 27% just after the results were released got my attention, so I put the kettle on, sat down at my desk and dived into the numbers.


Before we get stuck in, I recommend if you haven’t read or want a refresher, my original Cellnet article can be found here.

Description

A ~27% drop in the share price roughly a week after a report is released is quite worrying, with the typical things going through my head, What did I miss? How could I have got it so wrong? etc, compounded by the fact that I hadn’t had a chance to read it yet, let alone analyse it.

cellnet forecast results
Yahoo Finance, retrieved 24/02/2019

Fortunately for me, I have been reading a lot of Howard Marks lately, statements such as “The biggest investing errors come not from factors that are informational or analytical, but from those that are psychological” were still in the front of my mind. Armed with this and other powerful logical insights from Howard Marks, I calmed myself down and inverted the situation, maybe instead of looking at it as a potential mistake, I should look at it as a possible chance to average down.

HY Report

Looking at the first page, it’s clear that H1 2019 is not going as well as H1 2018, with a reduction in underlying operating profit before tax of ~32.3%.

cellnet forecast results

Positively they have seen an increase in revenue of 20.8%, when excluding the Turn Left acquisition, revenue still increased by 6.5%. A very positive sign, however they have clearly allowed expenses to blow out. Cellnet acknowledges this and attributes the decline in operating profit to the reduced dollar’s impact on materials, packaging and consumables used (AUD/USD has reduced from .78 to .71 in the past year, with it hovering around .71 over the past 6 months). They also wrote off $0.405mill of Turn left’s inventory, included in materials, packaging and consumables. Never one to take a person on their word (especially company directors, no matter how reputable or respected they may be), below I have tabulated Cellnet’s HY expenses as a percentage of revenue. It’s clear that there has been a large increase in materials, packaging and consumables, ~3.7% above the trailing 4 year average (~2.8% when adjusted for the inventory write-off). Within the report, Cellnet stated that “Measures have been taken in December 2018 to mitigate this impact”, which is encouraging, a reduction of 1% in expenses, sees an additional $0.522mill added to the profit before tax. Looking at the other expenses Cellnet has reduced their employee benefits, finance costs, freight expenses and occupancy expenses, a total reduction of 0.77% of revenue, which is excellent. The increases, D&A includes a $0.212mill in customer and supplier relationships acquired with Turn Left, materials explained above and warehousing expenses due to the increase in inventory. Which brings us on to the next section, the statement of financial position or better known as the balance sheet.

cellnet forecast results

Below I have tabulated interesting sections of the 2018 and 2019 HY balance sheets, along with the percentage change (%Δ) and also their % of total assets. Straight away you can see huge increases in assets, with inventory and trade and other receivables more than doubling, some of which can be attributed to the Turn Left acquisition, but not all. The reduced dollar, I would have thought, would be a time to reduce inventory stock levels, not more than double them. Is there stock no longer selling, a sign of the cyclical nature of the business or did they recently get a bargain on an item?  

Whilst the assets have increased a considerable amount, they are still roughly making up the same percentage of total assets, unfortunately the same can not be said of the increases in liabilities. Trade and other payables increased by 270% and current borrowings 530%, saying that another way, trade and other payables more than tripled whilst current borrowings increased by over 6 times. These are some really worrying increases, again some of these increase can be attributed to the Turn Left acquisition, but the magnitude of the increases is quite concerning. The result of all of this is a reduction in tangible assets of 20% and due to the Turn Left acquisition being partially paid for with shares, a reduction in Tangible assets per share of 28%. Interestingly they are currently trading at roughly their tangible asset per share price, $0.26.

cellnet forecast results

Along with the decrease in tangible assets the increase in borrowings increases the debt to equity to 1.581, which is a lot higher than their trailing 10 year average, excluding 2018, of ~1. I have included in the table below the debt/equity if Cellnet hadn’t purchased Turn Left, it however isn’t much better at 1.41, not unprecedented, by uncommon.

cellnet forecast results

Evaluation

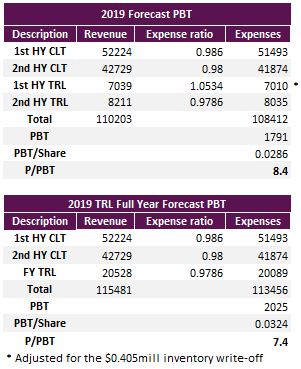
Below I have calculated my forecasted 2019 results both as is and if they had owned Turn Left for the entire year. Assumptions are as follows 

  • Over the past 8 years, Cellnet has generated, on average, 55% of their revenue in the first half of the year; Cellnet’s revenue for FY2019 is therefore predicted to  $94.95mill.
  • As Cellnet has stated that “Measures have been taken in December 2018 to mitigate” the low dollar, I have reduced the 2nd half’s expense ratio by .6% to 98% of revenue.
  • Cellnet stated that had they owned Turn Left for the entire year, they would have generated $64.54mill in revenue and $1.11m in profit before tax, which equates to a profit margin for TRL of 1.72 (expense ratio of 98.28). Using this and assuming that TRL generates 65% of their revenue in the 1st half, gives TRL's 2HY revenue of $8.21mill and profit of $0.176mill.
  • 1HY TRL expenses adjusted for the $0.405mill inventory write-off.
  • No. Of shares outstanding 62,595,096
  • Share price $0.245

cellnet forecast results

The result of all of this is a Profit before tax per share of 0.0286, which is slightly worse than 2017 and 2015, but falls quite below 2018 and 2016, see below. It also shows us that they are currently trading at a price to profit before tax of 8.4, which is slightly below the trailing 8 year P/PBT ratio average of 8.96 (excluding 2014 as it is an outlier).

cellnet forecast results

The 2019 TRL full year forecast, keeping all things equal, gives a good indication of the 2020 full year results. Which if correct and assuming the P/PBT increases to the current level of 8.1, will see the share price increase by ~13.25%.

Discussion

The increase in the expense ratio by 3.7% has really hurt Cellnet, added to this the untimely acquisition of Turn Left and you have the receipt for some disappointing results. The low profit margin of both Turn Left and Cellnet gives a lot of opportunity for improvement, especially when compared to their historical expense ratios. 

Cellnet has operated with the dollar at these low level (July 2015 to March 2016), however, today the global economy is in a much different position than it was then. Therefore unless the dollar rises back up in the near future the FY2016 expense ratio is not a comparative figure. I do believe that Cellnet will be able to reduce their expense ratio, just not as far as we have seen in recent years. To see the impact different expense ratio’s will have, I have tabulated, using FY2019 figures, the varying PBT for a range of expense ratios.


cellnet forecast results

A reduction of the expense ratio to 97.5% or 98% (which is still 1.61% and 2.11% above the trailing 4 year average) in 2020 and assuming all other things being equal, has Cellnet currently trading at a 5 – 7 multiple. These expense ratios are in my opinion achievable, Cellnet, since Alan Sparks took over, have been continuously driving expenses down. The multiples are however not amazing and certainly do not offer enough of a safety margin to rush out and buy. However I believe that keeping everything equal, the company is currently trading at roughly where it should be.

Keeping everything equal (or Ceteris Paribus for the economists or Latin speakers out there) is an assumption that I don’t believe is justified in today’s economy. The Australian dollar has been predicted to fall further in the short term, a likely result of a range of possibilities, more specifically, China’s economy slowing, a reduction in the demand for Australian resources (other than coal at the moment due to the tragedy in Brazil, but this too will balance out), a slowing of the world economy (due to a number of different reasons). All of these will further squeeze Cellnet's profit margin over the short term. They have in recent times started to expand into other markets, helping to untether their profits to the Aussie economy, but I think this may be a little too little too late.

Conclusion

Cellnet since Alan took over have reduced expenses, increased revenue, obtained strategic partners and increased their product mix, allowing them to enter a market that is predicted to grow quite substantially. On the negative side, over the first half of 2019, they have increased their debt to equity ratio to unprecedented levels and allowed expenses to blow out. Cellnet is a good company, 2019 is in my opinion an unfortunate culmination of two unrelated events that have impacted Cellnet quite substantially, I see it as a hiccup more than a ongoing problem.

After doing my analysis I believe that Cellnet is trading at roughly where they should be and therefore the loss has already been made. As consumer spending is predicted to decrease and the dollar as well, I believe that Cellnet will have a rough couple of years ahead but I see Cellnet as a long - term member of my portfolio. It, in my opinion, is therefore not a time to buy nor is it a time to sell (if you have a long term perspective and have no other better prospects), but a time to trust management and remember that we purchased a portion of the company for the long term. I am writing this constantly wondering if I am being affected by conformation bias, if you feel I am, feel free to get in contact or leave a message below, I am always happy to hear from people who visit and read my blog.

During my initial analysis of Cellnet, I did not consider the impact the lowering of the dollar would have on Cellnet. Howard Marks says “You can’t predict. You can Prepare”. Whilst the lowering of the dollar may be unpredictable, it should be included in a pre-mortem, allowing an investor to require an adquate safety margin. I believe that the underlying thesis for Cellnet is still good, there most likely wasnt a large enough safety margin when publishing my initial thesis.

One last Howard Marks' quote that I believe sums up my mistake in my original analysis of Cellnet perfectly, "There’s little that’s as dangerous for investor health as insistence on extrapolating today’s events into the future".

If you are interested in the retail industry, you can also read my opinion on Shaver Shop and The Reject ShopI am on Twitter  and Linkedin  if you’d like to connect, feel free to send me a msg, it’s always great to meet other ASX investors, especially those who have a different view point.


Thanks for reading


Just Culture Investor


Trav Mays


The author is a current owner of a portion of Cellnet, given this, they may be subject to one or a number of biases, more specifically anchoring and/or confirmation bias. This article is neither general nor personal advice and in no way constitutes specific or individual advice. The website and author do not guarantee, and accept no legal liability whatsoever arising from or connected to, the accuracy, reliability, currency or completeness of any material contained on this website or on any linked site. This website is not a substitute for independent professional advice and users should obtain any appropriate professional advice relevant to their particular circumstances. The material on this website may include the views or recommendations of third parties, which do not necessarily reflect the views of the website or author, or indicate its commitment to a particular course of action  


Subscribe

* indicates required

Intuit Mailchimp

Latest post

New Site