BlueScope Steel an excellent Value Company (ASX:BSL)
 |
| Port Kembla Source: www.bluescopesteel.com.au |
Trav Mays
Follow @MaysTrav


Description
BlueScope Steel (ASX:BSL) is a “global leader in premium
branded coated and painted steel products - the current largest manufacturer of
painted and coated steel products globally”. BlueScope has 5 major segments,
Australian Steel Products, North Star, Building North America, NZ & Pacific
Steel and Building Products Asia & North America. These segments are spread
out over 17 countries with more than 100 facilities and 14,000 employees.
Whilst having a large array of brands under the BlueScope banner, their main
brands are Colorbond, Clean Colorbond and Zincalume steels, Lysaght steel
building products and Butler and Varco Pruden engineered buildings.
History
BlueScope listed on the ASX on 15th July 2002 after it
split off from BHP and as with many manufacturing companies, it has had a
turbulent ride since then. The share price initially increased from the IPO
price of $11.14 to just over $48 in 2007, before falling to a low of $1.6 in
2012. The effects of the Global Financial Crisis were extended for BlueScope, as the
global economy contracted, the iron ore price increased by an astronomical
amount, from below $40/tonne in 2007 to over $180/tonne in 2010. These high
coal prices along with a strong Aussie dollar and low steel prices lead
Bluescope to post over a billion dollar loss in 2011.
To combat this, Bluescope ceased all exports from their Port
Kembla Mill, resulting in ~800 employees being stood down and a further 200
jobs being lost at the Western Port Steel Mill. Macro conditions improved over
the coming years, however Bluescope continued to struggle to make a profit with
the 90 year blast furnace at Port Kembla, again considering shutting it down in
2015. It was during these deliberations that Bluescope expanded further into
America, purchasing the remaining 50% of the North Star Mill, taking their
control to 100%. This increased their percentage of non-current assets in America from 17%
to 44%. This formed part of
a strategic move away from Australia, beginning in 2010, Bluescope began to
expand into New Zealand, Asia and America, almost halving their percentage of
non-current assets in Australia, 63% in 2010 to 36% in 2017.
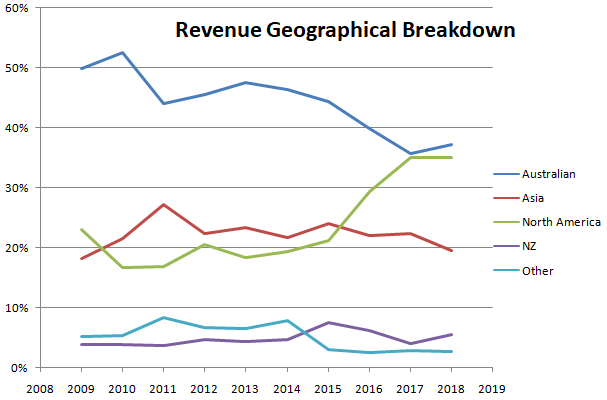
The movement of assets translated into a movement of their revenue base. Revenue sourced from Australia reduced from 53% in 2010 to 37% in
2018, whilst in America it went from 17% to 35%.
One of the largest costs facing Australia at the moment is
electrical costs. BlueScope always looking to the future and for potential
opportunities, has entered into the largest solar Power Purchase Agreement with
ESCO Pacific and Schnider Electric. The 7 year agreement will supply roughly
20% of BlueScope Australia’s Electrical requirements, taking most of the 133MW
output of the Finley Solar farm, located 100km west of Albury.
Competition
The 2017 acquisition of Liberty Onesteel would have been an excellent
opportunity to price BlueScope, however as it was purchased by the private
conglomerate GYG Alliance, the price they paid has been kept a secret.
Nevertheless, BlueScope has many other competitors for comparison, especially with
their further expansion into North America.
As you can see
below, using a number of the common value metrics, BlueScope is by far the better purchase
at current prices. BlueScope is not only ranked the overall best but has the best
values in 7 out of the 11 categories and isn’t last in any of them. US Steel
scored the second lowest, however the difference was still 10 points higher
with the rest scoring double or more than BlueScope. From a business perspective, BlueScope has the highest profit margin and lowest Debt/Equity. In fact, they are
actually net cash positive, with $63 million in cash left after paying off all
of their debt.
The similar Pitroski score shows that the gain in 2018 was
seen across the industry and therefore was a result of outside influences, iron
ore prices, steel prices, Trump’s election and protectionism etc. We therefore
cannot allow the Pitroski score to have much of an impact on the eventual
decision. It also needs to be said, that as a large number of these metrics are
related to price, the lower share price of BlueScope will cause this type of analysis
to favour BlueScope. The cause for the large decrease in share price needs to be
further examined before a final decision can be made.
Evaluation
On a comparison basis, BlueScope is by far the superior steel
manufacturer, however just because it is has scored the best, does not mean
that it is currently mispriced enough to warrant purchase, especially when
taking into consideration the need for a sizeable margin of safety.
Joel Greenblatt made the enterprise value (EV) multiple a
popular analysis technique. By using the average industry and historical
multiples, you can compare the current price with those paid historically and
industry wide. Using the industry average EV multiple of 6.56 results in a BlueScope's share price of $22.6 a 104% increase on current prices, whilst using BlueScope’s 5
year average gives an increase of 83% to $20.27/share. The returns are of
considerable size, however as with all evaluation techniques, these are just a
small component of the overall analysis. The reason for the downbeat share
price needs to be thoroughly investigated.
While share price increases will make up the bulk of any
gains you make once purchasing a business, the total return to the shareholder
including dividends and buybacks is more important. BlueScope has tendered to buyback
shares, which for a long term investor, assuming that the share price during
the buyback is trading below its intrinsic value (read excellent commentary
about that here),
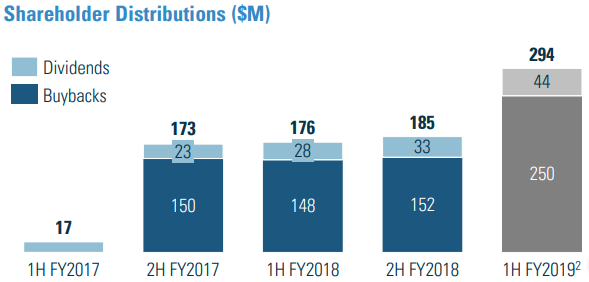
is the best use of a company’s excess capital. BlueScope returned ~22% of its 2018
profits and is set to continue returning value to share holders, having already
begun another $250 mill buyback.
Possible Causes of the Current Share Price
Despite BlueScope earning a large profit, the share price has been
falling from a high of $18.60/share to 52 week lows of $10.56/share.
The potential causes of which are huge, from the dreaded and
unpredictable “tweet” risk to the low AUS/US exchange rate. Below is a list of
potential risks that I believe could have the biggest impact and are therefore
causing the share price to fall.
-
US/The world trade tensions
-
Tweet risk
-
AUS/US exchange rate
-
Trump risk
-
Unstable Australian Government
-
Iron Ore prices
-
Steel Prices
-
China
-
New CEO
-
Global Recession
As you can see, a
large number of these are not BlueScope specific risks but global risks, with the
Trump risk helping to increase short term US profits through tariffs.
The low AUS/US exchange rate, whilst at one stage would have
had a much larger impact on the Bluescope, has been somewhat mitigated by their
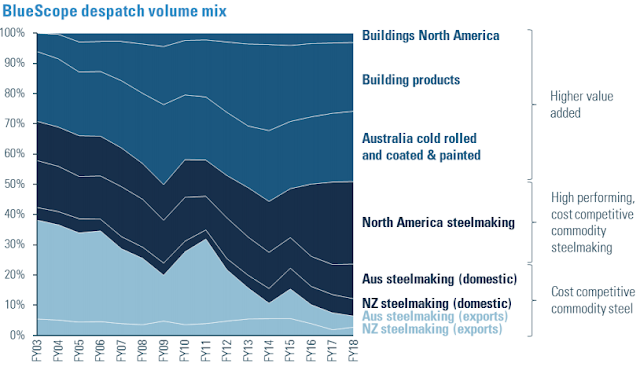
global expansion. As you can see below, Bluescope has decreased the Australian
Steelmaking exports significantly, resulting in the exchange rate only significantly
affecting the cost of internationally sourced or US priced inputs for
Australian manufacturing. The low AUS/US exchange rate will have a positive
effect on the US operations when converted to $AUS.
The appointment of Mark Vassella as CEO was an excellent
choice, given his vast steel industry experience, especially within the US
market. I don’t believe this is having an effect. In fact, it’s my opinion that
it is the uncontrollable effects that are pushing the share price down. The
uncertainty of Trump and the US/China trade negotiations are having a roll on
effect into the iron ore and steel prices. I believe it is these risks that are
causing investors to currently be cautious. Along with this, as with all
industries, China is an ever present behemoth with the ability to create
further chaos for the steel industry. A Chinese economy stimulation package
involving steel production, could cause a large drop in the steel price whilst
increasing the iron ore price; this would obviously have a large impact on
BlueScope. With all the uncertainty a margin of safety is paramount to an
investor’s long term success.
Recommendation
BlueScope Steel, is an excellent example of a value company,
however the reason for the low share price could be warranted. A good
understanding of the major risks is extremely important to facilitate a
realistic risk reward analysis. Fundamentally, whether an Investor chooses to
invest in BlueScope will come down to their global economy outlook. If you are
optimistic, the future is bright, tensions will ease and stability will resume.
However if you are pessimistic, than I would suggest looking elsewhere for an
investment opportunity. I tend to believe the actual outcome will be somewhere
between the two, but more towards the optimistic side of the spectrum. As with
most people I can’t predict the future (read more about that here), I do however
believe it’s time to begin thinking about Warren Buffett’s quote "Be fearful when others are
greedy and greedy when others are fearful".
As a business, BlueScope has very little debt, a global
presence, is net cash positive, ranks higher than other major competitors, is
run by an excellent management team and recently confirmed their 1H 2019
underlying EBIT guidance of 10% higher than 2H 2018 ($745M). They have learnt
from the most recent recession and have reduced their exposure to a given country.
It is due to all of this that I believe that BlueScope Steel will prove to be
an excellent long term investment.
Thanks for reading
Just Culture Investor
Trav Mays
The author is a current owner of a portion
of BlueScope Steel, given this, they may be subject to one or a number of
biases, more specifically anchoring and/or confirmation bias. This article is
neither general nor personal advice and in no way constitutes specific or
individual advice. The website and author do not guarantee, and accept no legal
liability whatsoever arising from or connected to, the accuracy, reliability,
currency or completeness of any material contained on this website or on any
linked site. This website is not a substitute for independent professional
advice and users should obtain any appropriate professional advice relevant to
their particular circumstances. The material on this website may include the views
or recommendations of third parties, which do not necessarily reflect the views
of the website or author, or indicate its commitment to a particular course of
action
Thursday, 13 December 2018
Looking for trouble at RCR Tomlinson (ASX:RCR)
 |
| Darling Downs Solar Farm |
14/08/2019
Trav Mays
Follow @MaysTrav

1. https://www.rcrtom.com.au/about-rcr/

RCR Tomlinson (ASX:RCR) recently entering voluntary administration, whilst potentially devastating to a large number of people, the thousands of employees and
shareholders especially, offers a great learning opportunity. This post
will try and identify any potential early warning signs that we may be able to
use in the future when examining businesses. This post won’t be an examination
of the managers or the operations of the business, it will be an investigation
searching for any early warning signs within the financial statements only.
Whilst doing this examination, I
have tried to put myself in the position of the shareholder. However, given
that I know the final result I am obviously heavily influenced by hindsight
bias. With this in mind, I would like to make it apparent that I am in no way
criticising any person for either purchasing or hanging onto their shares.
Whether a person decides to purchase or to retain a portion of a business is
governed by many things, such as their risk tolerance, expertise, level of
knowledge, etc. I have made many mistakes, mostly recently Donaco (read about
that one here), my desire is to learn from
history (it’s a shame that we learn more from mistakes than successes), not to
criticise any market participant. Unfortunately learning from history is easier
said than done, as Mark Twain said “History
doesn’t repeat itself but it often rhymes”.
Company
RCR is a 120 year old Australian
Engineering and Infrastructure Company, working with some of the world’s
leading organisations to provide intelligent engineering solutions to the
Infrastructure, Energy and Resources sectors. “RCR’s core capabilities
encompass; development, engineering, procurement, construction (“EPC”),
operation and maintenance of major infrastructure and resource projects. These
include power generation plants (using a wide
range of fuels; solar, wind, battery and hydro), water and waste treatment systems, rail and road tunnel infrastructure, rail signalling and
overhead wiring systems, mineral processing and material handling plants, integrated oil & gas services
(both onshore and offshore), supply of RCR proprietary materials handling and process equipment,
and property services including facilities management, HVAC and electrical services”1.
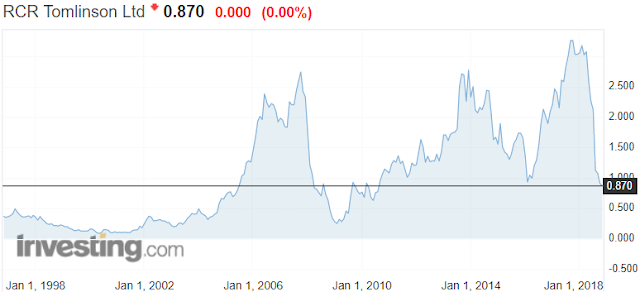
They have had a wild ride in the
stock price, recently reaching highs not seen since just before the 2007 bust
and the 2014 oil price dive with a subsequent fall similar to that seen in 2008.
 |
| RCR Tomlinson's Share Price |
Warning Signs
Gross Margin
The gross margin showed clear
signs that something wasn’t right at RCR and that further analysis was
warranted. As you can see below, after improving their gross margin to a very
impressive 9.9% in 2014, it fell dramatically, to 5.1% in 2016 and continued on
its downward trajectory to 1.34% in 2018.
 |
| RCR Tomlinson's Share Price |
Gross margin between 2018 and
2015 was being squeezed due to a disproportionate increase of revenue (93%) and
cost of sales (111%). As you can see in Table 1, the main culprits up to 2018
for the increase were materials and other costs with employee benefits further
exacerbating the expense in 2018.
 |
| RCR Tomlinson's Cost of Sales |
Breaking this down further in to
RCR’s operating segments, it is clear that the initially it was just the energy
segment, reducing its EBIT margin to 1% from 5% in 2016. The energy and resources
segments include RCR’s power generation and mining operations, as with all
companies operating in these segments, they were hit hard by the extreme drop
in the oil price in 2014. The 2018 recovery of energy would be partly due to
the recovery of the oil price, with WTI crude reaching a high of US$74/barrel, still
far shy of the pre 2014 crash highs of US$105/barrel.
 |
| RCR Tomlinson's Gross Margin |
One of RCR’s main core
capabilities of the infrastructure segment is the renewable energy systems,
where they offer all engineering facets, design, construction, commissioning,
operation and maintenance. Whilst the administrators are still examining the
firm’s financials for the cause of their recent troubles, it is believed that
RCR took on renewable energy contracts without a firm understanding of
connection risks. Along with this, it has been stated that they offered fixed
contracts, resulting in all project over run costs being borne by RCR. These
two underlining issues came to fruition in 2018, resulting in a large loss for
the infrastructure segment of $9.8mill, far below the trailing 4 year average
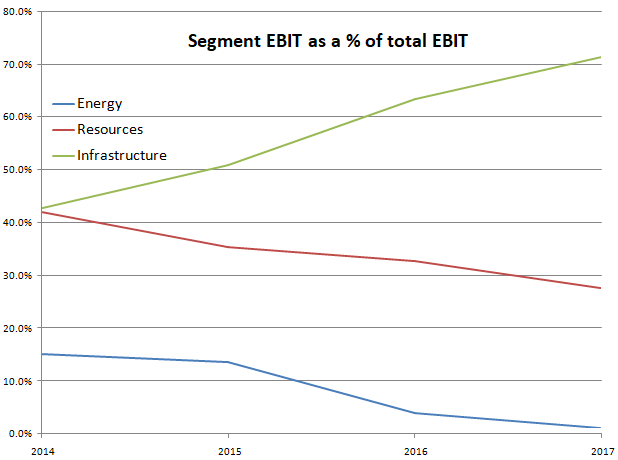
profit of $30mill. This is especially troublesome for RCR, as over 70% of their
EBIT in 2017 was generated in the infrastructure segment.
 |
| RCR Tomlinson's Segment EBIT as a % of Total EBIT |
Trade and other payables
Another troubling sign was the
huge increase in trade and other payables, increasing from 35% of equity in
2016 to 110% in 2017. Between 2009 and 2016, trade and other payables was an
average 46% of equity, between 2017 and 2018 it increased to 116%. Interestingly,
as their trade bills increased they continued to pay down their borrowings,
reducing their borrowings/equity ratio by an impressive 73.5% between 2014 and
2018.
 |
| RCR Tomlinson's Debt/Equity |
Discussion
In 2016, the reduction in gross
margin could be attributed to an unfortunate project running over time and/or
cost, but when the trend continued in 2017 a deeper evaluation was clearly warranted.
This evaluation would have unearthed the huge increase in trade and other
payables, this along with a shrinking margin should have been a huge red flag
for owners, signalling that something wasn’t right. It’s easy to type this
after the fact, I too could have been persuaded by the rising share price, as
it trotted it was up to a 249% increase in a year and a half. Along with
this, a lot of great analyst believed the same and typically when they are all
in agreeance, they are usually right. Unfortunately on this occasion they were
not.
I could continue to say things
such as they should have renegotiated their debt and paid down their trade and
other payables, focused more heavily on increasing the energy margin, or sold
it off as it was only making a small percentage of EBIT, but these and other
similar statements are built on assumptions made on hearsay and speculation. We
will need to wait for the report from the administrators to make a full
examination.
The main thing I learnt from
this analysis is that trends hold the key to finding issues and signs of areas
that require a deeper dive into the weeds. It also further highlights the need for us to do
our own analysis and to not be swayed by share prices. Once the analysis has
been completed, then compare it to the price you calculated, if it is too high,
sell, if it’s low and gives you a good margin of safety, buy.
I am on Twitter Follow @MaysTrav and Linkedin  if you’d like to connect, feel free to send me a msg, it’s always great to meet other ASX investors, especially those who have a different view point.
 if you’d like to connect, feel free to send me a msg, it’s always great to meet other ASX investors, especially those who have a different view point.
1. https://www.rcrtom.com.au/about-rcr/
This article is neither general nor personal advice and in no way constitutes specific or individual advice. The website and author do not guarantee, and accept no legal liability whatsoever arising from or connected to, the accuracy, reliability, currency or completeness of any material contained on this website or on any linked site. This website is not a substitute for independent professional advice and users should obtain any appropriate professional advice relevant to their particular circumstances. The material on this website may include the views or recommendations of third parties, which do not necessarily reflect the views of the website or author, or indicate its commitment to a particular course of action
Monday, 3 December 2018
My horrible mistake; Donaco International (ASX:DNA)
 |
| Aristo Casino, Vietnam |
03/12/2018
Trav Mays
Donaco (ASX:DNA) is the most recent mistake/lesson I have made, so in the spirit of Benjamin Franklin who said “that wise men profit from the mistakes of others, while fools will not learn even from their own blunders”, I write this post in the hope of making myself less of a fool. While all lessons need to be thoroughly investigated, the cost of this lesson necessitates a deeper investigation to ensure that I ring all of the knowledge out of it I can. This post however won’t be a complete list of my errors, there aren’t enough bits of information in the universe to store that list, but it will cover the two largest, focusing too little on management prior to the purchase and my ability to succumb to the anchoring and confirmation biases post purchase.
Company outline
Donaco is the result of the 2013
merger between Two Way (TTV), a gambling applications developer for TV, mobile
and computers and Donaco Singapore, which had a 75% stake in the Lao Cai
International Hotel (now called Aristo) in Vietnam. The new management acted
quickly with a strong focus on the Aristo Casino, selling the TV wagering
service, initiating a $52mill upgrade to the casino and increasing their share to
95% (the final 5% is owned by the Vietnamese Government) all within 2013. They
went onto sell and spin off the remaining non casino businesses, Way2Bet and
iSentric, in 2014. In essence, Two Way raised capital through a share offering
to purchase Donaco, it than appointed the Donaco Managing Director as CEO and
sold everything off, transformed itself from a gambling application developer
into an Asian casino owner, despite the fact that not one of the board had any
Casino experience.
Prior to the acquisition of
Donaco, Two Way had not made a profit and in fact had an average year on year revenue
decrease of 6% between 2007 and 2012. Post the acquisition, between 2013 and
2015, normalised profit reduced by 128% from a $9mill profit to a $2.5m loss. Donaco
stated that the poor result in 2014 was “affected by headwinds during the soft
opening period, including China/Vietnam tensions, Soccer World Cup and Yunnan
earthquake, while 2015’s poor result was “due to the VIP growth win rate of
1.64%, which was well below last year’s above – theoretical level of 4.01%”. At
this point, they purchased another casino, Star Vegas in Poipet Cambodia for
US$360mill. Included in the Star Vegas purchase was a 2 year warranty, insuring
that the FY EBITDA will total at least US$60mill per year, with any short fall
being made up by a cash payment by the vendor, who was appointed to the board.
Mistake 1: Management
It was just after this falling
out that I purchased my shares, believing that the reduction in the share price
was a short term reaction to the ousting of the Vendor. I, by not doing my due
diligence, especially when it came to management’s lack of casino experience
and its poor results at the Aristo casino, should have seen that the ousted
vendor/board member, was the only person will any successful casino experience.
The other point that Donaco
stated as having a negative effect on the casino’s result was the opening of
another casino by the vendor. Donaco stated that the vendor was not only
operating the Star Paradise casino but also had another illegal casino
operating out the back of a supermarket. This should have had red flags for me.
If a business cannot operate within a market where they are given a
semi-monopoly by the government, than there is little hope for the business.
The illegal casino that they mention is inconsequential, if an illegal casino
operating out the back of a supermarket is able to affect the results of a
large and established casino by a material amount, than there is something
seriously wrong at Star Vegas.
This is especially worrying due to the fact that between
2015 – 2017, Naga World, Cambodia’s number 1 casino had an average year on year
profit increase of ~22% and in their first 6 months of trading in 2018, have
increased their profit a further ~19.6%. While it could be argued that this is
an unfair comparison, they were subjected to all the same headwinds as Donaco
and instead of making excuses, thrived.
Whether or not what Donaco has
stated is true, there is an underlying theme at Donaco, management’s ability to
blame any poor result on an unforeseen and completely outside influence. This is
the real point that I believe I missed, any person can learn how to manage a
casino, but as Dr. Robert Anthony said “When you
blame others, you give up your power to change” and by not seeing that it was
them, the management that was to blame, they denied themselves the power to
learn, improve and change.
 |
| CEO's total compensation vs Donaco's profit |
Mistake 2 Anchoring and Confirmation Biases
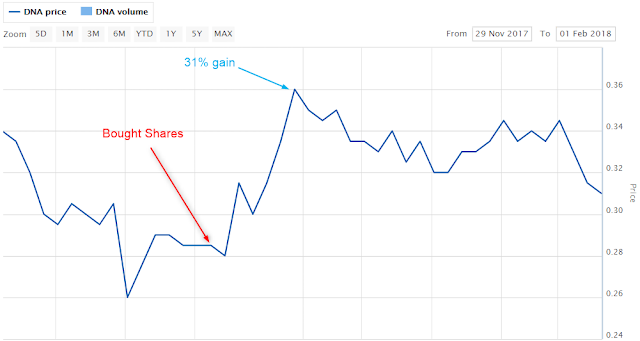
In the short term the market
believed as I did, resulting in a 31% gain in a few short weeks. This initial
gain caused me to become overconfident in my abilities. As time went on, this
overconfidence resulted in me developing 2 very powerful biases, anchoring and
confirmation.
As you can see below, I went on
to purchase shares 2 more times over the next year, all the while believing
that I would sell them once they went back up to ~$0.35 and I could get back
that initial gain of 31%. I, as Benjamin Graham
said is a mistake, confused speculation with investing and paid dearly for it,
resulting in a 67.4% loss.
 |
| Donaco Share Price and my Purchases and Sales Nov 2017 - Dec 2018 |
Warren Buffet summed me and this mistake up perfectly when he said "The
line separating investment and speculation, which is never bright and clear,
becomes blurred still further when most market participants have recently
enjoyed triumphs. Nothing sedates rationality like large doses of effortless
money. After a heady experience of that kind, normally sensible people drift
into behavior akin to that of Cinderella at the ball."
Catalyst
The reason I sold out in the end
was not due completely to Donaco’s 2018 normalised profit reduction of ~64%, it
was Donaco’s management again blaming outside influences, stating the result
was again due to the usual excuses, with the addition of Chinese organised
crime scaring off customers.
Conclusion
If this post has painted Donaco
and its management in a horrible light, this is not my intention. I have chosen
to only include some of the points that should have shown red flags prior and
post my purchase. I didn’t talk about the good work that has been going on at
Donaco, the addition of night clubs, restaurants, online gambling apps, etc.
that my confirmation bias used to keep me hanging on. And it may very well be
true, that Donaco has been unfairly impacted by headwinds and that the
management has done an excellent job navigating them, but the point is, that I
should have never purchased a portion of Donaco. The uncertainty around the
ousting of the vendor means that this was a purely speculative purchase and I
am not in the speculative game. I try to purchase businesses similar to Charlie Munger and Warren Buffet as a business owner, not as a stock owner.
This post – mortem has uncovered
two very large flaws in my evaluation process. While the current accounting numbers
are extremely important in the screening of possible businesses, it’s the management
that I need to focus more heavily on. They are the ones who are deploying the
capital and therefore have total control over any future returns. My other
biggest learning’s are to do a pre-mortem and to be more realistic in my
evaluations after the purchase.
Looking back is easy, as the
proverb states, after the ship has sunk, everyone knows how she might have been
saved and I just hope I have learnt how to save myself next time.
This article is neither general nor personal advice and in no way constitutes specific or individual advice. The website and author do not guarantee, and accept no legal liability whatsoever arising from or connected to, the accuracy, reliability, currency or completeness of any material contained on this website or on any linked site. This website is not a substitute for independent professional advice and users should obtain any appropriate professional advice relevant to their particular circumstances. The material on this website may include the views or recommendations of third parties, which do not necessarily reflect the views of the website or author, or indicate its commitment to a particular course of action
Tuesday, 27 November 2018
Turnaround success at Cellnet (ASX:CLT)
27/11/2018
Trav Mays
Follow @MaysTrav

Description
Cellnet (ASX:CLT), formed in
1992, is a market leader in the warehouse and distribution industry with
centres in Australia, China and New Zealand. Their main source of revenue is
warehousing and distribution, however they also own the 3SIXT technology brand,
selling everything from phone covers and screen protectors to action video
cameras. They are currently the exclusive supplier to Optus, Vodafone, Noel
Leeming and Lagardere, where they manage each peg, giving Cellnet up to date
information on stock levels and customer preferences.
Cellnet by 2014 had become
unfocused, increasing the number of brands in their fold to 72. As with Icarus, the wings that were originally their source of
success, lead to their eventual downfall. Whilst the additional brands were
bringing in more revenue, Cellnet’s expenses accelerated at a faster pace,
culminating in a large loss in 2014 and the removal of the then current CEO and
appointment of Alan Sparks to replace him.
Cellnet under the excellent
management of Alan Sparks, have achieved a remarkable feat, as Warren Buffett
says “Turnarounds seldom Turn”, Cellnet, defying the odds, falls into the
seldom group. Mr. Sparks began by cutting the expenses and streamlining the
business, reducing the number of brands to just 12 in 2014. Despite the smaller
number of brands, Cellnet has modestly increased revenue, however their
greatest achievement has been in the reduction of expenses. This is seen
through the large disparity in revenue to profit growth, revenue grew an
average of 5.2% pa whilst profit grew an average of 15.9% pa. These numbers are
heavily affected by the loss in 2014 and the subsequent recovery of 2015. A
better representation of Mr. Sparks and his team’s efforts is the last three
years, where they have achieved an average per annum revenue and profit growth
of 4.6% and 25.1% respectively.
To further help Cellnet reach its
potential, a partner was sought who not only understood the business, but would
bring with them knowledge and synergies, they found WentronicHolding GmbH. Wentronic purchased 79.77% (56.19%, 2018) of Cellnet in
2016 and with it, it brought over 25
years of knowledge and experience operating a similar and considerably larger
business than Cellnet. Wentronic is a privately owned warehouse and
distribution company with over 300 staff, 12000 products and 5 branches
throughout Europe and Asia. Wentronic opened up supply chain channels that
Cellnet couldn’t have gained alone, contributing significantly to the reduction
in expenses. Further to this, Wentronic and Cellnet in 2018 entered into a
joint venture company (51% Wentronic, 49% Cellnet) incorporated in Singapore,
Wentronic International Pte. Ltd. The purpose of which is to expand the
Wentronic and Cellnet products into markets outside Europe, Australia and New
Zealand, with both companies proportionately picking up the bill.
This joint venture coincided with
another development in 2018, 11.4% of Cellnet’s shares were purchased by a
strategic Partner JEJ, the investment vehicle of Cybernetic
of Taiwan. Cybernetic has been distributing Philips (Mr. Sparks worked for
Philips for over 7 years) accessories since 1993, shipping to many counties
including Taiwan, Turkey, Middle East Africa, Russia,
Ukraine and South America, connecting Cellnet to countries they currently don’t
sell into.
More recently (07/09/2018)
Cellnet purchased Turn Left, a warehouse and distribution company focusing on
gaming software and accessories for $6 mill. Turn Left currently outsources its
warehousing and with parallel retail partners (eg. Jb Hifi, Noel Lemming etc.)
Cellnet has ample opportunities for synergies. Turn
Left being a reputable company with distribution rights to companies such as Thrustmaster,
Steelseries, Plantronics and Kontrol Freek gives Cellnet easy access to this
lucrative and expanding (estimated 6.1% CAGR 2018-2026) market.
Gaming Hardware
Growth Rate (Source: Transparency Market Research)
Management
Complementing Mr. Alan Spark’s 40
years experience, Mr Michael Wendt (Chairman & Non-Executive Director) has
over 26 years in international retail and distribution experience. Mr Tony
Pearson (Non-Executive independent Director) has many years of board and
committee experience. Mr Michael Reddie (Non-Executive Independent Director) the
current director of Reddie Lawyers has experience in consulting clients in
M&A, Corporate Governance, Joint Ventures and strategic alliances both
domestically and internationally. Rounding out the experience board is Mr Kevin
Gilmore (Non-Executive Director) who is the current Director of Sales for
Wentronic Asia Pacific brings with him experience in management positions at
multinational corporations such as GE, Shell, Philips Electronics and Belkin.
Competition
Cellnet’s currently has limited
competition and due to this, there is little information regarding market size
and share. Force Technology International, a
privately owned company, is their main Australian competition. They work in the
same telecommunication space as Cellnet, offering cases, screen protectors etc
to their clients. Other notable competitors are Ingram Micro Ltd and Synnex
Corporation. While there is limited information regarding Cellnet’s market
share, it is my belief that they currently control a large section of the
market. They have the sole distribution rights to Optus, Vodafone, Noel Leeming
and Lagardere, they also supply all the big retailers such as JB Hifi, Kmart
etc. and are also taking advantage of the online space, selling on websites
such as Amazon and Ebay.
As there is no direct competition
to compare Cellnet to, evaluation is quite hard. It’s my belief that under such
circumstances caution is called for and I would only invest under excellent
circumstances. Below is a section of the evaluation metrics that I use, as you
can see, Cellnet has quite good scores for the traditional value metrics, .27
Price to Sales, 1.1 Price to Tangible Book, 7.08 Price to Normalised Earnings.
Along with these great values, Cellnet currently has a Pitroski Score of 8 and
a Z score of 7.72.
Catalyst
As the common aphorism states “A
raising tide lifts all ships” the inverse of this is just as true. The recent
uncertainty about the US/China trade war and the general concern of the global
economy reaching the final stages of the bull market, has resulted in stock
markets around the world reducing collectively. Despite all of the recent
changes, the acquisition of Turn Left, the joint venture between Cellnet and
Wentronic, JEJ becoming a strategic partner, the reduction in debt of 3.9 mill
and the increase in normalised profit of 34%, the market is currently pricing
Cellnet at only 5 million more than it was worth a year ago. Over the long
term, I believe the market will see the true worth of Cellnet and the price
will reflect it.
Reason to not invest
As a large percentage of shares
are owned by insiders, this reduces liquidity and some people would therefore
demand a premium. One of the main reasons for this is because the owner has
little to no influence on the shareholder votes, no large blocks can be
purchased and therefore you are essentially just going along for the ride. In
cases such as this, management has far more importance than usual, while it is
paramount that any business you purchase has reputable management, buying into
a company where your vote will do little to nothing, means that you must have
absolute faith in the management team.
Along with the low liquidity,
across the world there is a general consensus that we are nearing the final
stages of the bull market. This has many investors worried, causing them to move
their money into safer assets, driving stock prices lower. This worry is
especially true in Australia where we have low household savings rates, low
wage growth, high household debt, house prices falling sharply (mostly in the
east coast capitals) and a reduction in Chinesse demand for Australian
resources, is causing many households to tighten their purse strings. This will
have a negative and dramatic impact on the discretionary spending, where once
people may have upgraded their gaming hardware or phone, they will postpone or
stop all together these purchases. This will have a flow on effect to Cellnet
as their suppliers purchase less and less products.
Recommendation
The low liquidity to many would
seem as a reason not to invest, however if you are a long term investor seeing
the purchase as part ownership in a business than this is something that should
not concern you. As Charlie Munger says “The big money is not in the buying and
selling, but in the waiting”.
Cellnet is a turnaround story;
one that I believe has been playing out long enough to prove that it’s not just
a short term effect. They have increased their product range and further
diversified their risk by pushing their products onto the rest of the world. While
the global downturn, further exacerbated in Australia due to country specific
conditions, is a real risk to Cellnet, I believe they have positioned
themselves well to weather this storm and it is due to these conditions that
Cellnet has reduced to a price that I believe offers real value.
Thanks for reading
Just Culture Investor
Trav Mays
The author is a current owner of a portion of Cellnet, given this, they
may be subject to one or a number of biases, more specifically anchoring and/or
confirmation bias. This article is neither general nor personal advice and in no way
constitutes specific or individual advice. The website and author do not
guarantee, and accept no legal liability whatsoever arising from or connected
to, the accuracy, reliability, currency or completeness of any material
contained on this website or on any linked site. This website is not a
substitute for independent professional advice and users should obtain any
appropriate professional advice relevant to their particular circumstances. The
material on this website may include the views or recommendations of third
parties, which do not necessarily reflect the views of the website or author,
or indicate its commitment to a particular course of action
Follow @MaysTrav


Description
Cellnet (ASX:CLT), formed in 1992, is a market leader in the warehouse and distribution industry with centres in Australia, China and New Zealand. Their main source of revenue is warehousing and distribution, however they also own the 3SIXT technology brand, selling everything from phone covers and screen protectors to action video cameras. They are currently the exclusive supplier to Optus, Vodafone, Noel Leeming and Lagardere, where they manage each peg, giving Cellnet up to date information on stock levels and customer preferences.
Cellnet by 2014 had become
unfocused, increasing the number of brands in their fold to 72. As with Icarus, the wings that were originally their source of
success, lead to their eventual downfall. Whilst the additional brands were
bringing in more revenue, Cellnet’s expenses accelerated at a faster pace,
culminating in a large loss in 2014 and the removal of the then current CEO and
appointment of Alan Sparks to replace him.
Cellnet under the excellent
management of Alan Sparks, have achieved a remarkable feat, as Warren Buffett
says “Turnarounds seldom Turn”, Cellnet, defying the odds, falls into the
seldom group. Mr. Sparks began by cutting the expenses and streamlining the
business, reducing the number of brands to just 12 in 2014. Despite the smaller
number of brands, Cellnet has modestly increased revenue, however their
greatest achievement has been in the reduction of expenses. This is seen
through the large disparity in revenue to profit growth, revenue grew an
average of 5.2% pa whilst profit grew an average of 15.9% pa. These numbers are
heavily affected by the loss in 2014 and the subsequent recovery of 2015. A
better representation of Mr. Sparks and his team’s efforts is the last three
years, where they have achieved an average per annum revenue and profit growth
of 4.6% and 25.1% respectively.
To further help Cellnet reach its
potential, a partner was sought who not only understood the business, but would
bring with them knowledge and synergies, they found WentronicHolding GmbH. Wentronic purchased 79.77% (56.19%, 2018) of Cellnet in
2016 and with it, it brought over 25
years of knowledge and experience operating a similar and considerably larger
business than Cellnet. Wentronic is a privately owned warehouse and
distribution company with over 300 staff, 12000 products and 5 branches
throughout Europe and Asia. Wentronic opened up supply chain channels that
Cellnet couldn’t have gained alone, contributing significantly to the reduction
in expenses. Further to this, Wentronic and Cellnet in 2018 entered into a
joint venture company (51% Wentronic, 49% Cellnet) incorporated in Singapore,
Wentronic International Pte. Ltd. The purpose of which is to expand the
Wentronic and Cellnet products into markets outside Europe, Australia and New
Zealand, with both companies proportionately picking up the bill.
This joint venture coincided with
another development in 2018, 11.4% of Cellnet’s shares were purchased by a
strategic Partner JEJ, the investment vehicle of Cybernetic
of Taiwan. Cybernetic has been distributing Philips (Mr. Sparks worked for
Philips for over 7 years) accessories since 1993, shipping to many counties
including Taiwan, Turkey, Middle East Africa, Russia,
Ukraine and South America, connecting Cellnet to countries they currently don’t
sell into.
More recently (07/09/2018)
Cellnet purchased Turn Left, a warehouse and distribution company focusing on
gaming software and accessories for $6 mill. Turn Left currently outsources its
warehousing and with parallel retail partners (eg. Jb Hifi, Noel Lemming etc.)
Cellnet has ample opportunities for synergies. Turn
Left being a reputable company with distribution rights to companies such as Thrustmaster,
Steelseries, Plantronics and Kontrol Freek gives Cellnet easy access to this
lucrative and expanding (estimated 6.1% CAGR 2018-2026) market.
Gaming Hardware
Growth Rate (Source: Transparency Market Research)
Management
Complementing Mr. Alan Spark’s 40
years experience, Mr Michael Wendt (Chairman & Non-Executive Director) has
over 26 years in international retail and distribution experience. Mr Tony
Pearson (Non-Executive independent Director) has many years of board and
committee experience. Mr Michael Reddie (Non-Executive Independent Director) the
current director of Reddie Lawyers has experience in consulting clients in
M&A, Corporate Governance, Joint Ventures and strategic alliances both
domestically and internationally. Rounding out the experience board is Mr Kevin
Gilmore (Non-Executive Director) who is the current Director of Sales for
Wentronic Asia Pacific brings with him experience in management positions at
multinational corporations such as GE, Shell, Philips Electronics and Belkin.
Competition
Cellnet’s currently has limited
competition and due to this, there is little information regarding market size
and share. Force Technology International, a
privately owned company, is their main Australian competition. They work in the
same telecommunication space as Cellnet, offering cases, screen protectors etc
to their clients. Other notable competitors are Ingram Micro Ltd and Synnex
Corporation. While there is limited information regarding Cellnet’s market
share, it is my belief that they currently control a large section of the
market. They have the sole distribution rights to Optus, Vodafone, Noel Leeming
and Lagardere, they also supply all the big retailers such as JB Hifi, Kmart
etc. and are also taking advantage of the online space, selling on websites
such as Amazon and Ebay.
As there is no direct competition
to compare Cellnet to, evaluation is quite hard. It’s my belief that under such
circumstances caution is called for and I would only invest under excellent
circumstances. Below is a section of the evaluation metrics that I use, as you
can see, Cellnet has quite good scores for the traditional value metrics, .27
Price to Sales, 1.1 Price to Tangible Book, 7.08 Price to Normalised Earnings.
Along with these great values, Cellnet currently has a Pitroski Score of 8 and
a Z score of 7.72.
Catalyst
As the common aphorism states “A
raising tide lifts all ships” the inverse of this is just as true. The recent
uncertainty about the US/China trade war and the general concern of the global
economy reaching the final stages of the bull market, has resulted in stock
markets around the world reducing collectively. Despite all of the recent
changes, the acquisition of Turn Left, the joint venture between Cellnet and
Wentronic, JEJ becoming a strategic partner, the reduction in debt of 3.9 mill
and the increase in normalised profit of 34%, the market is currently pricing
Cellnet at only 5 million more than it was worth a year ago. Over the long
term, I believe the market will see the true worth of Cellnet and the price
will reflect it.
Reason to not invest
As a large percentage of shares
are owned by insiders, this reduces liquidity and some people would therefore
demand a premium. One of the main reasons for this is because the owner has
little to no influence on the shareholder votes, no large blocks can be
purchased and therefore you are essentially just going along for the ride. In
cases such as this, management has far more importance than usual, while it is
paramount that any business you purchase has reputable management, buying into
a company where your vote will do little to nothing, means that you must have
absolute faith in the management team.
Along with the low liquidity,
across the world there is a general consensus that we are nearing the final
stages of the bull market. This has many investors worried, causing them to move
their money into safer assets, driving stock prices lower. This worry is
especially true in Australia where we have low household savings rates, low
wage growth, high household debt, house prices falling sharply (mostly in the
east coast capitals) and a reduction in Chinesse demand for Australian
resources, is causing many households to tighten their purse strings. This will
have a negative and dramatic impact on the discretionary spending, where once
people may have upgraded their gaming hardware or phone, they will postpone or
stop all together these purchases. This will have a flow on effect to Cellnet
as their suppliers purchase less and less products.
Recommendation
The low liquidity to many would
seem as a reason not to invest, however if you are a long term investor seeing
the purchase as part ownership in a business than this is something that should
not concern you. As Charlie Munger says “The big money is not in the buying and
selling, but in the waiting”.
Cellnet is a turnaround story;
one that I believe has been playing out long enough to prove that it’s not just
a short term effect. They have increased their product range and further
diversified their risk by pushing their products onto the rest of the world. While
the global downturn, further exacerbated in Australia due to country specific
conditions, is a real risk to Cellnet, I believe they have positioned
themselves well to weather this storm and it is due to these conditions that
Cellnet has reduced to a price that I believe offers real value.
Thanks for reading
Just Culture Investor
Trav Mays
The author is a current owner of a portion of Cellnet, given this, they
may be subject to one or a number of biases, more specifically anchoring and/or
confirmation bias. This article is neither general nor personal advice and in no way
constitutes specific or individual advice. The website and author do not
guarantee, and accept no legal liability whatsoever arising from or connected
to, the accuracy, reliability, currency or completeness of any material
contained on this website or on any linked site. This website is not a
substitute for independent professional advice and users should obtain any
appropriate professional advice relevant to their particular circumstances. The
material on this website may include the views or recommendations of third
parties, which do not necessarily reflect the views of the website or author,
or indicate its commitment to a particular course of action


